Copyright
©2006 Baishideng Publishing Group Co.
World J Gastroenterol. May 14, 2006; 12(18): 2864-2869
Published online May 14, 2006. doi: 10.3748/wjg.v12.i18.2864
Published online May 14, 2006. doi: 10.3748/wjg.v12.i18.2864
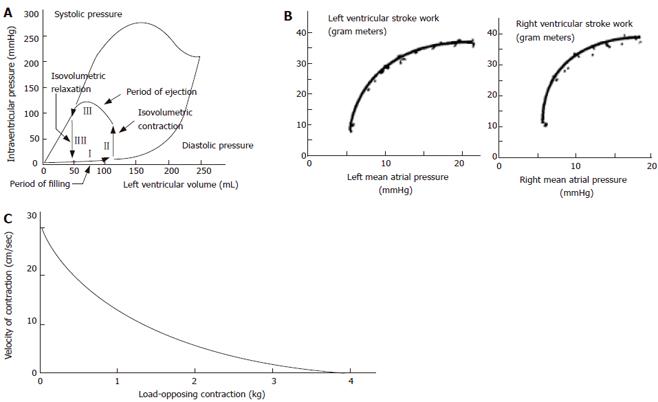
Figure 1 A: Relationship between left ventricular volume and pressure during diastole and systole.
The arrows indicate the four phases of the volume-pressure diagram during the normal cardiac cycle; B: Ventricular function curves expressing the Frank-Starling mechanism of the heart, i.e. the intrinsic ability of the heart to adapt to changing volumes of inflowing blood; C: Schematic plot of shortening velocity vs force. The relationship has in muscle tissues shown to be hyperbolic. The y-intercept is called Vmax which reflects the maximum crossbridge turnover rate. The x-intercept is the peak isometric force, Fmax, which is determined by the number of attached crossbridges (Modified from Guyton and Hall 2002 and others).
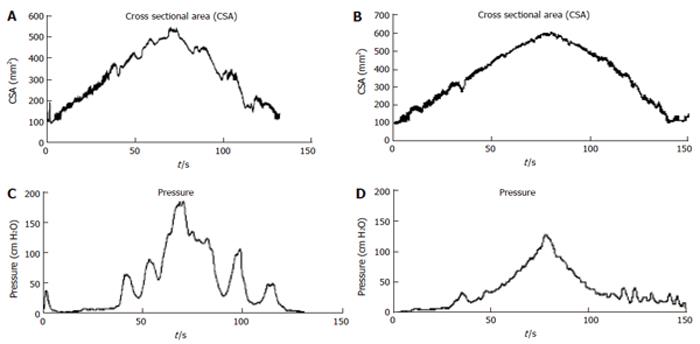
Figure 2 Cross-sectional area (CSA), and pressure as function of time during the distension of esophagus without (A, C) and during (B, D) the administration of butylscopolamine.
Modified from previous publications by Gregersen and coworkers.
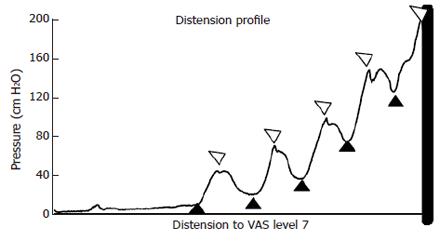
Figure 3 Illustration of a ramp distension curve in the human esophagus.
The thick line at the end of the curve is the reverse point. The open symbols above the curve mark the phasic part and the afterload pressure. The closed symbols under the curve mark the tonic part of the distension curve and the preload pressure. The passive pressure is measured from the tonic part of the curve during administration of butylscopolamine. At the symbols pressure and CSA was measured and radius and tension was computed from these values. Modified from previous publications by Gregersen and coworkers.
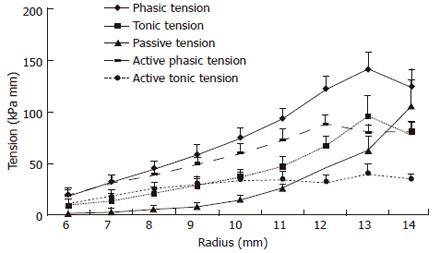
Figure 4 The active and passive tension-radius curves for a subject where the maximum active tension is reached before the moderate pain level (top).
The bottom graph shows the averaged data from all volunteers. Mean and SEM values are shown. Modified from previous publications by Gregersen and coworkers.
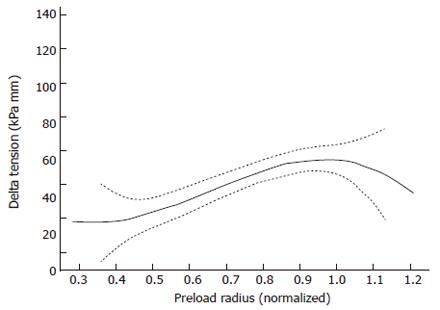
Figure 5 Representation of the change in muscle tension during distension-induced contractions as function of the radius immediately before the contraction (preload-afterload properties) of the esophageal muscles.
The solid line is the polynomial fit and the dotted lines represent 95% confidence intervals. Modified from previous publications by Gregersen and coworkers.
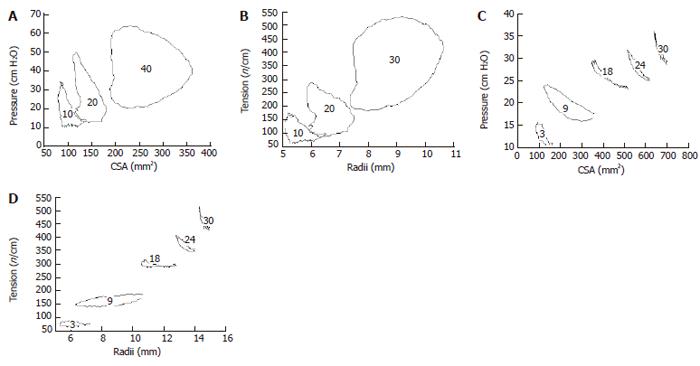
Figure 6 Pressure-CSA and tension-radius relations during esophagus contractions (A, B) and during duodenum contractions (C, D).
The numbers in the figures indicate the volume in ml.
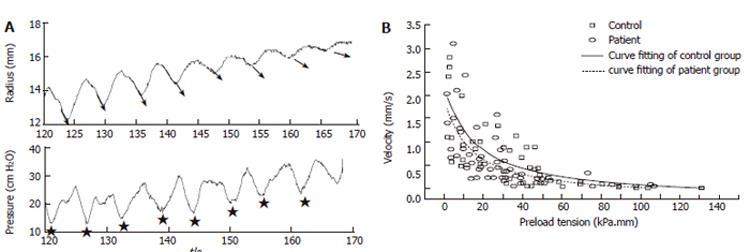
Figure 7 A: Arrows indicate that the slope (velocity decreases at high loads.
The stars indicate the preload tension; B: Force-velocity curves represented as circumferential preload tension-radius shortening velocity and preload tension-circumferential preload tension*CSA rate in SS patients (symbol O and dashed line) and controls ( and solid line). The tension-velocity data were curve fitted using Hill’s equation. Modified from previous publications by Gregersen and coworkers.
- Citation: Gregersen H, Liao D. New perspectives of studying gastrointestinal muscle function. World J Gastroenterol 2006; 12(18): 2864-2869
- URL: https://www.wjgnet.com/1007-9327/full/v12/i18/2864.htm
- DOI: https://dx.doi.org/10.3748/wjg.v12.i18.2864


