Copyright
©2006 Baishideng Publishing Group Co.
World J Gastroenterol. May 14, 2006; 12(18): 2839-2845
Published online May 14, 2006. doi: 10.3748/wjg.v12.i18.2839
Published online May 14, 2006. doi: 10.3748/wjg.v12.i18.2839
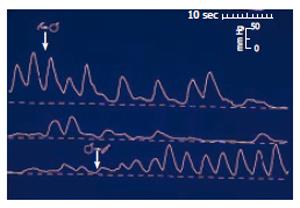
Figure 1 Sphincter of Oddi manometry in a dog during gallbladder distension (upper tracing), and gallbladder emptying (lower tracing).
Distension of the gallbladder-mimicking gallbladder contraction -leads to relaxation of the sphincter of Oddi thus permitting free flow of bile into the duodenum. (After reference 5 with permission).
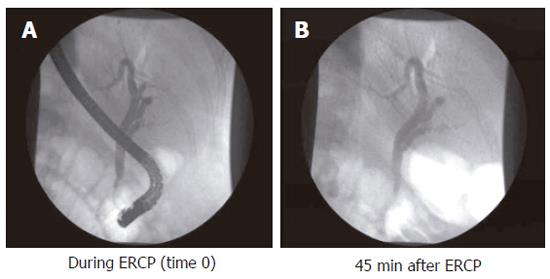
Figure 2 Endoscopic cholangiogram during investigation, and 45 min after contrast injection in a patient with complete contrast retention.
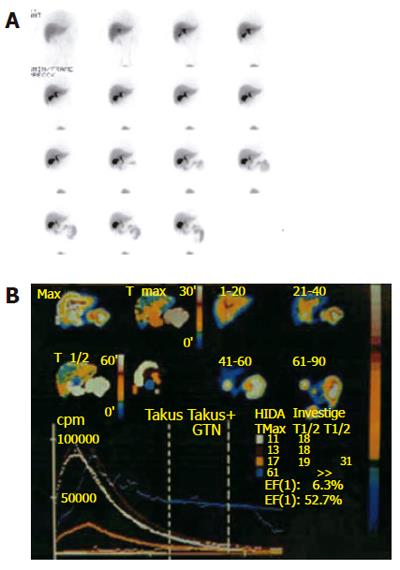
Figure 3 Hepatobiliary scintigraphy.
A: Pictures at different time windows; B: Time activity curves are shown for different regions of interest.
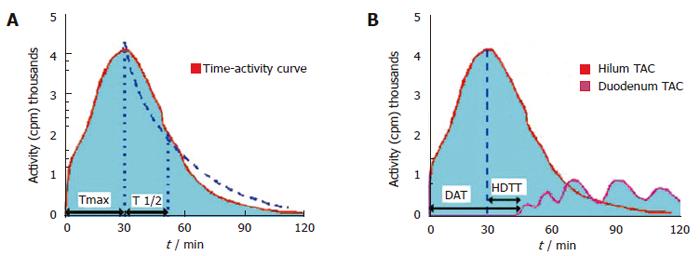
Figure 4 Hepatobiliary scintigraphic activity curves of regions of interest in sphincter of Oddi dysfunction.
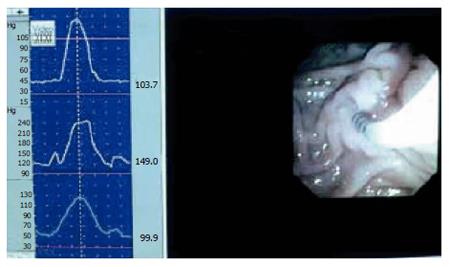
Figure 5 Combined video- and manometric recording in the sphincter of Oddi during endoscopy.
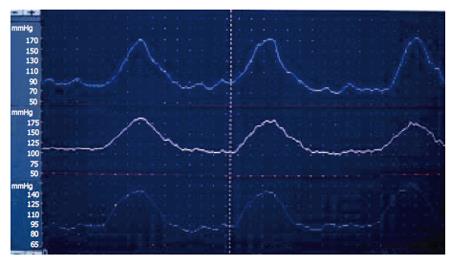
Figure 6 Endoscopic sphincter of Oddi manometry in a patient with elevated baseline pressure.
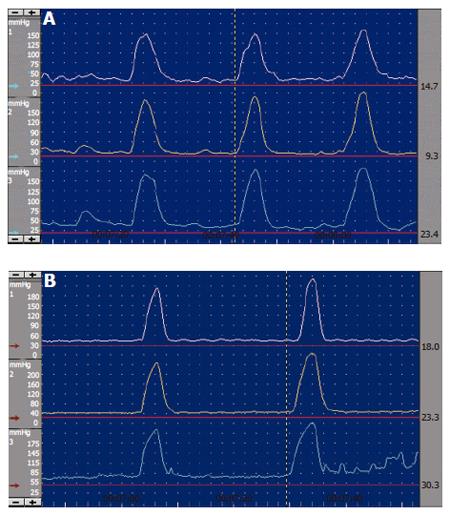
Figure 7 Endoscopic sphincter of Oddi manometry.
A: Normal antegrade contractions; B: Abnormal retrograde waves.
- Citation: Funch-Jensen P, Drewes AM, Madácsy L. Evaluation of the biliary tract in patients with functional biliary symptoms. World J Gastroenterol 2006; 12(18): 2839-2845
- URL: https://www.wjgnet.com/1007-9327/full/v12/i18/2839.htm
- DOI: https://dx.doi.org/10.3748/wjg.v12.i18.2839


