Copyright
©2006 Baishideng Publishing Group Co.
World J Gastroenterol. May 7, 2006; 12(17): 2742-2748
Published online May 7, 2006. doi: 10.3748/wjg.v12.i17.2742
Published online May 7, 2006. doi: 10.3748/wjg.v12.i17.2742
Figure 1 Chromatograms of spiked plasma sample (B), plasma samples of patients before (A) and after (C) the administration of 200 mg ranitidine.
M1 and M2 are metabolites of ranitidine.
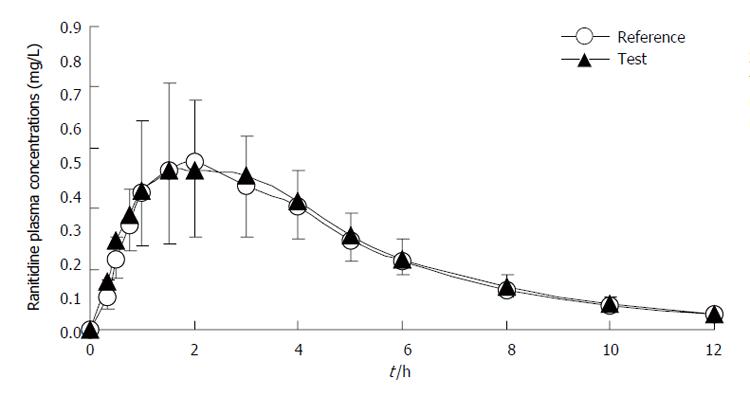
Figure 2 Concentration-time curves of ranitidine in 20 Chinese volunteers after oral administration of two compound preparations.
n = 20. Mean ± SD. Bars indicate standard deviations (lower bars for test drug and upper bars for reference drug).
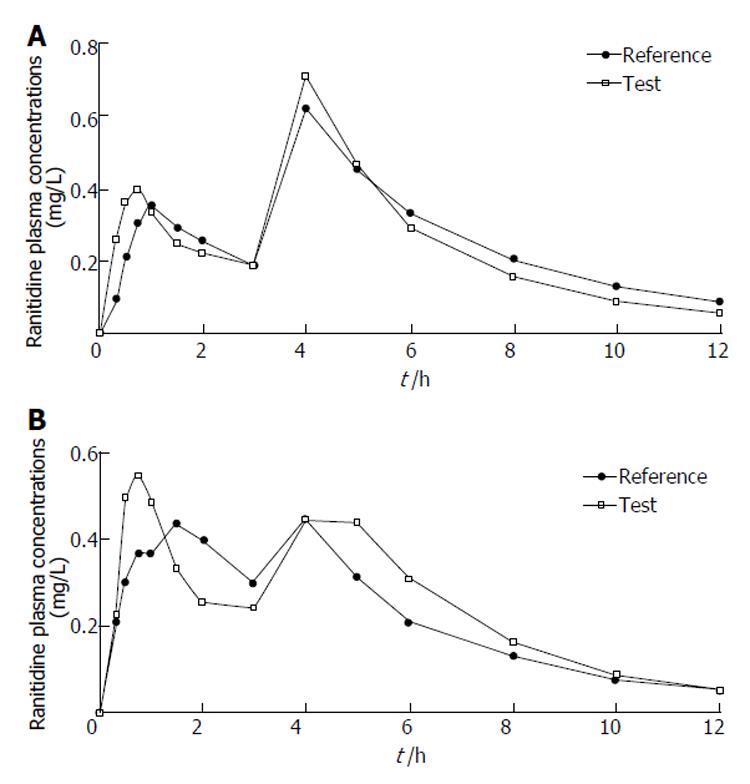
Figure 3 Typical double-peak plasma profiles of ranitidine in two Chinese volunteers (№14 and №16) after oral administration of two compound preparations.
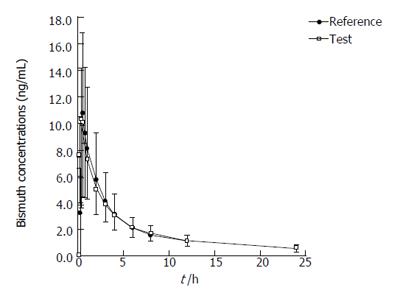
Figure 4 Concentration-time curves of bismuth in 20 Chinese volunteers after oral administration of two compound preparations.
n = 20, mean ± SD. Bars indicate standard deviations (lower bars for test drug and upper bars for reference drug).
- Citation: Zhou Q, Ruan ZR, Yuan H, Jiang B, Xu DH. Pharmacokinetics and bioequivalence of ranitidine and bismuth derived from two compound preparations. World J Gastroenterol 2006; 12(17): 2742-2748
- URL: https://www.wjgnet.com/1007-9327/full/v12/i17/2742.htm
- DOI: https://dx.doi.org/10.3748/wjg.v12.i17.2742


