Copyright
©2006 Baishideng Publishing Group Co.
World J Gastroenterol. Apr 7, 2006; 12(13): 2053-2059
Published online Apr 7, 2006. doi: 10.3748/wjg.v12.i13.2053
Published online Apr 7, 2006. doi: 10.3748/wjg.v12.i13.2053
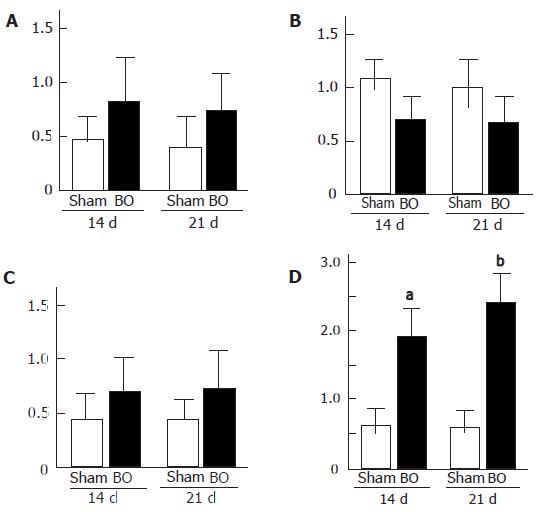
Figure 1 A: Hepatocyte growth factor (HGF); B: c-Met; C: vascular endothelial growth factor (VEGF); D: transforming growth factor-β1 (TGF-β1) mRNA expression in rat liver at 14 and 21 d after biliary obstruction (BO) and sham-operation (sham).
(aP < 0.05 vs sham-operated control, bP < 0.03 vs sham-operated control). Results are expressed as mean ± SD of n = 10 for each period in each group.
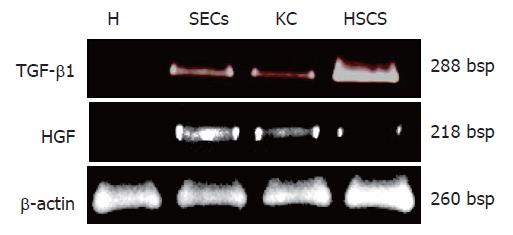
Figure 2 Hepatocyte growth factor (HGF) and transforming growth factor-β1 (TGF-β1) mRNA expression in isolated rat liver cells (H: hepatocytes; SECs: sinusoidal endothelial sells; KC: Kupffer cells; HSCs: Hepatic stellate cells) 14 d after biliary obstruction (BO).
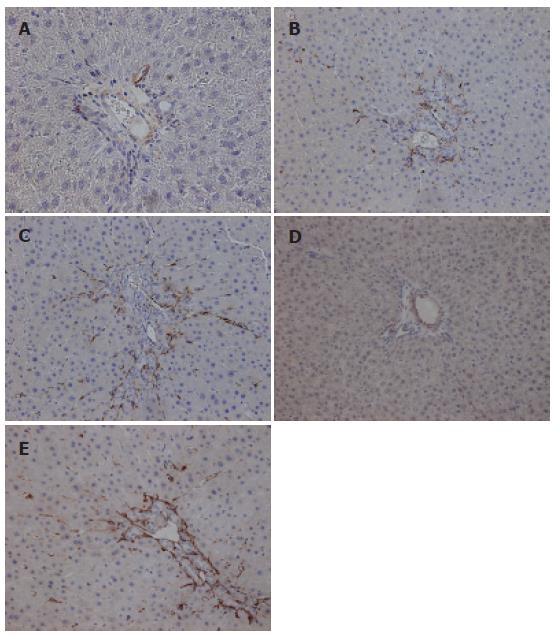
Figure 3 Immunohistochemical staining for desmin A: 14 d after sham operation; B: 14 d after biliary obstruction (BO); C: 21 d after biliary obstruction.
Immunohistochemical staining for α-smooth muscle actin (α-SMA); D: 14 d after sham operation; E: 14 d after biliary obstruction.
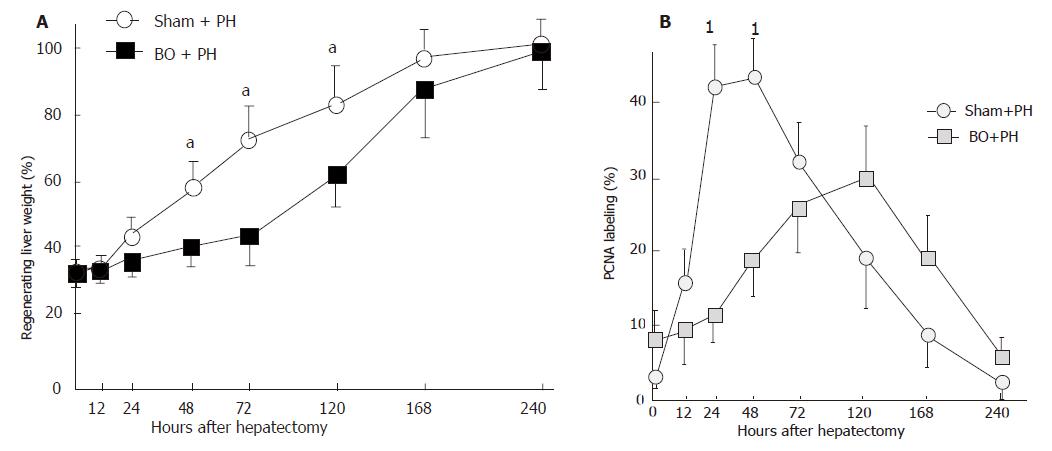
Figure 4 A: Changes in regenerating liver weight ratio after 70% partial patectomy (PH) in the sham-operated (sham) rats and the biliary obstructed (BO) rats (aP <0.
05 between the BO + PH group and the sham + PH group). Results are expressed as mean ± SD of n = 10 for each period in each group. B: Changes in the hepatocyte PCNA labeling index after 70% hepatectomy (PH) in the sham-operated (sham) rats and the biliary obstructed (BO) rats (1P < 0.03 between the BO + PH group and the sham + PH group). Results are expressed as mean ± SD of n = 10 for each period in each group.
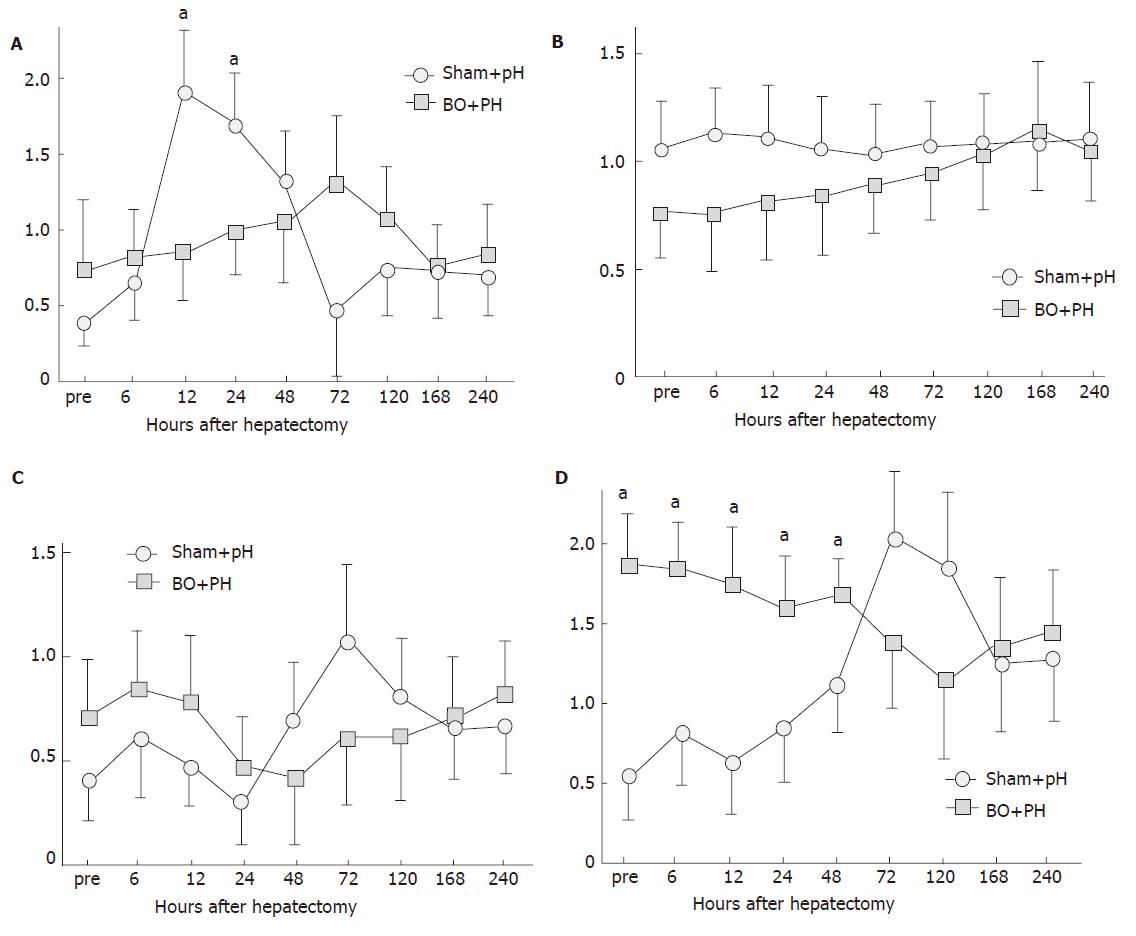
Figure 5 Changes in A: hepatocyte growth factor (HGF); B: c-Met; C: vascular endothelial growth factor (VEGF); D: transforming growth factor-β1 (TGF-β1) mRNA expression after partial hepatectomy (PH) in the sham-operated (sham) rats and the biliary obstructed (BO) rats (aP <0.
05 between the BO + PH group and the sham + PH group). Results are expressed as mean ± SD of n = 10 for each period in each group.
- Citation: Makino H, Shimizu H, Ito H, Kimura F, Ambiru S, Togawa A, Ohtsuka M, Yoshidome H, Kato A, Yoshitomi H, Sawada S, Miyazaki M. Changes in growth factor and cytokine expression in biliary obstructed rat liver and their relationship with delayed liver regeneration after partial hepatectomy. World J Gastroenterol 2006; 12(13): 2053-2059
- URL: https://www.wjgnet.com/1007-9327/full/v12/i13/2053.htm
- DOI: https://dx.doi.org/10.3748/wjg.v12.i13.2053


