©2006 Baishideng Publishing Group Co.
World J Gastroenterol. Jan 7, 2006; 12(1): 21-28
Published online Jan 7, 2006. doi: 10.3748/wjg.v12.i1.21
Published online Jan 7, 2006. doi: 10.3748/wjg.v12.i1.21
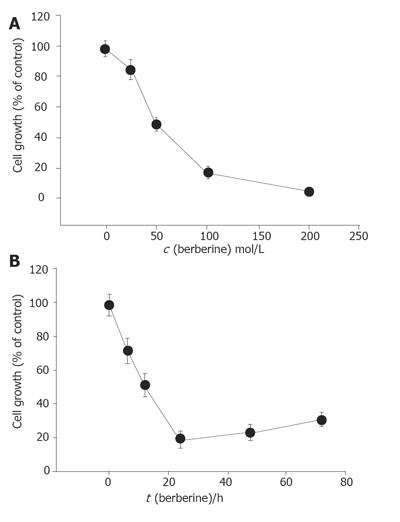
Figure 1 Percentage of viable SNU-5 cells treated with berberine with 24-h incubation.
The SNU-5 cells (2×10⁵ cells/well; 12-well plate) were plated in 80% Iscove’s modified Dulbecco’s medium+20% FBS with different concentrations of berberine for 24 h (Panel A) or 100 µmol/L berberine for 6, 12, 24, 48, and 72 h (Panel B). Then the cells were collected by centrifugation and the viable cells were determined by trypan blue exclusion and flow cytometry as described in Materials and Methods. Each point is mean ± SD of three experiments.
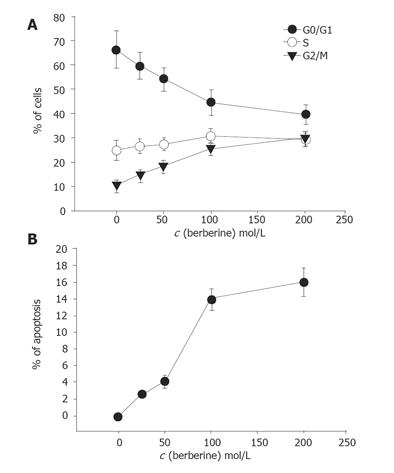
Figure 2 Flow cytometric analysis of the effects of berberine on SNU-5 cell cycle and sub-G1 group.
The SNU-5 cells were exposed to various concentrations of berberine for 48 h, and the cells were harvested and analyzed for cell cycle (Panel A: the percent of cells in phase) and sub-G1 group (Panel B: the percent of cells in apoptosis) were analyzed by flow cytometry as described in Materials and methods. Data represents mean ± SD of three experiments.
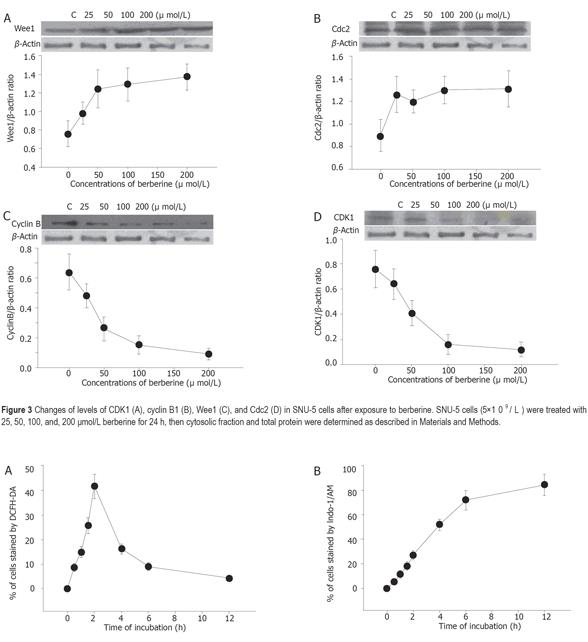
Figure 3 Changes of levels of CDK1 (A), cyclin B1 (B), Wee1 (C), and Cdc2 (D) in SNU-5 cells after exposure to berberine.
SNU-5 cells (5×10⁹/L) were treated with 0, 25, 50, 100, and, 200 μmol/L berberine for 24 h, then cytosolic fraction and total protein were determined as described in Materials and Methods.
Figure 4 Flow cytometric analysis of reactive oxygen species (A) and Ca2+ concentration (B) in human gastric carcinoma SNU-5 cells with 100 µmol/L berberine for various time periods.
The SNU-5 cells (5×10⁵ cells/mL) were treated with 100 μmol/L berberine for 0, 0.5, 1, 1.5, 2, 4, 6, and 12 h to detect the changes of ROS and Ca2+ cmcentration. The zero cancentration was defined as control. The percentage of cells stained with DCFH-DA dye was determined by flow cytometry as described in the Materials and Methods section.
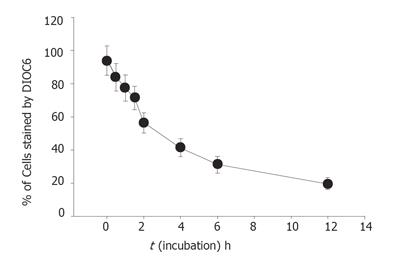
Figure 5 Flow cytometric analysis of mitochondrial membrane potential in human SNU-5 cells with 100 µmol/L berberine for various time periods.
The SNU-5 cells (5×10⁵ cells/L) were treated with various concentrations of berberine. The zero concentration was defined as control. The percentage of cells stained with DiOL6 dye, was determined by flow cytometry as described in the Materials and Methods.
Figure 6 Flow cytometric analysis of the effects of berberine induced caspase-3 activity (A) and apoptosis (B).
The SNU-5 cells were incubated with 100 µmol/L berberine with or without z-VAD-fmk treatment for determination of caspase-3 activity and apoptosis.
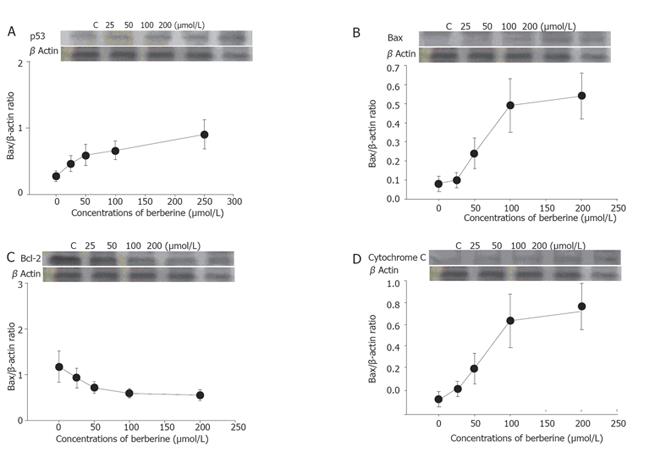
Figure 7 Changes of levels of p53(A), Bcl-2(B), Bax(C), and cytochrome C (D) in SNU-5 cells after exposure to berberine.
SNU-5 cells (5×10⁶/mL) were treated with 0, 25, 50, 100, and 200 μmol/L berberine for 24 h, then cytosolic fraction and total protein were determined as described in Materials and Methods. The levels of p53, p21, Bcl-2, Bax, and cytochrome C were determind by Western blotting as described in Materials and Methods.
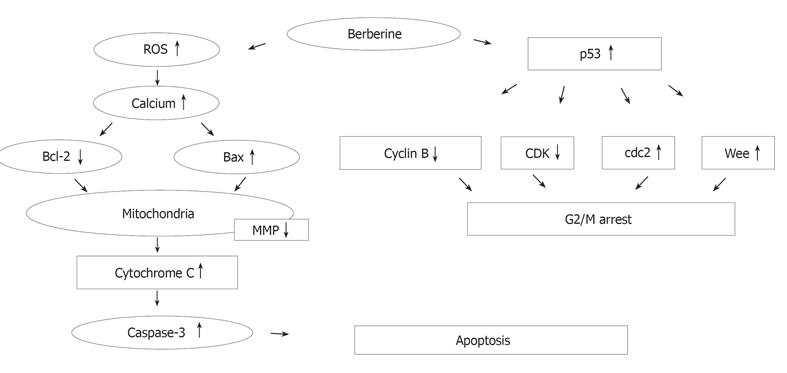
Figure 8 Proposed model of berberine mechanism of action on G2/M arrest and apoptosis in SNU-5 cells.
Berberine induced p53 expression that led to the decrease of cyclin B and CDK1 but increase of the expression of cdc25c and Wee1 for G2/M arrest. Berberine induced ROS, Ca2+ production and decreased MMP levels led to cytochrome C release and caspase-3 activity, causing apoptosis in SNU-5 cells.
- Citation: Lin JP, Yang JS, Lee JH, Hsieh WT, Chung JG. Berberine induces cell cycle arrest and apoptosis in human gastric carcinoma SNU-5 cell line. World J Gastroenterol 2006; 12(1): 21-28
- URL: https://www.wjgnet.com/1007-9327/full/v12/i1/21.htm
- DOI: https://dx.doi.org/10.3748/wjg.v12.i1.21


