Copyright
©2005 Baishideng Publishing Group Inc.
World J Gastroenterol. Dec 14, 2005; 11(46): 7237-7241
Published online Dec 14, 2005. doi: 10.3748/wjg.v11.i46.7237
Published online Dec 14, 2005. doi: 10.3748/wjg.v11.i46.7237
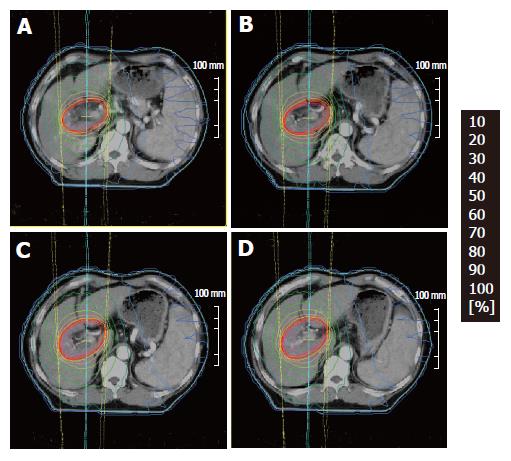
Figure 1 An example of dose distributions (A, B, C, D) in 3D-CRT.
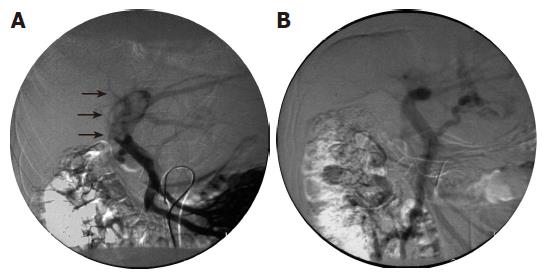
Figure 2 Angiographs of the portal vein showing disappearance of a tumoral embolus after irradiation therapy.
Angiographs taken before and after treatment are shown to the left (A) and right (B), respectively.
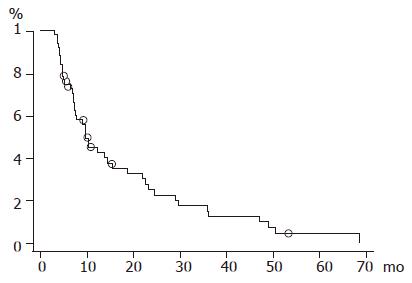
Figure 3 Overall survival curve.
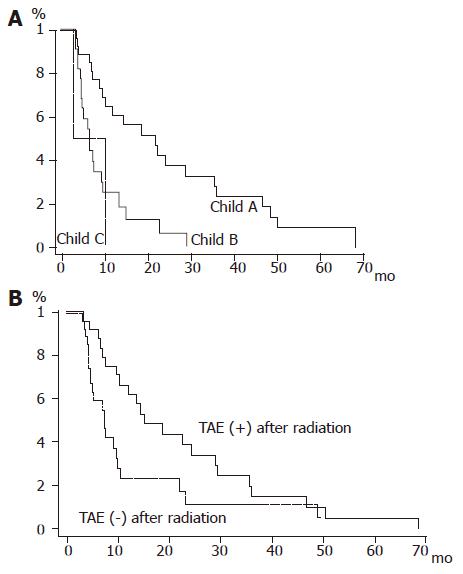
Figure 4 A: Survival curves according to Child classification.
Solid line: Child A; bold line: Child B; dashed line: Child C; B: Survival curves for the patient group with and without post-radiation TAE. Solid line: post-radiation TAE (+); dashed line: post-radiation TAE (–).
- Citation: Nakagawa K, Yamashita H, Shiraishi K, Nakamura N, Tago M, Igaki H, Hosoi Y, Shiina S, Omata M, Makuuchi M, Ohtomo K. Radiation therapy for portal venous invasion by hepatocellular carcinoma. World J Gastroenterol 2005; 11(46): 7237-7241
- URL: https://www.wjgnet.com/1007-9327/full/v11/i46/7237.htm
- DOI: https://dx.doi.org/10.3748/wjg.v11.i46.7237


