Copyright
©2005 Baishideng Publishing Group Inc.
World J Gastroenterol. Nov 14, 2005; 11(42): 6716-6721
Published online Nov 14, 2005. doi: 10.3748/wjg.v11.i42.6716
Published online Nov 14, 2005. doi: 10.3748/wjg.v11.i42.6716
Figure 1 Skp2, p27 and PTEN expression in different gastric tissues (DAB and hematoxylin stain).
A: Positive Skp2 in nuclei of intestinal metaplasia and dysplasia cells (original magnification ×400); B: Positive Skp2 in nuclei of well-differentiated gastric carcinoma cells (original magnification ×400); C: Positive Skp2 in nuclei of poorly differentiated gastric carcinoma cells (original magnification ×100); D: Positive Skp2 in lymphatic metastatic gastric carcinoma cells (original magnification ×100); E: Positive p27 in nuclei of well-differentiated gastric carcinoma cells (original magnification ×400); F: Positive PTEN in nuclei of well-differentiated gastric carcinoma cells (original magnification ×400).
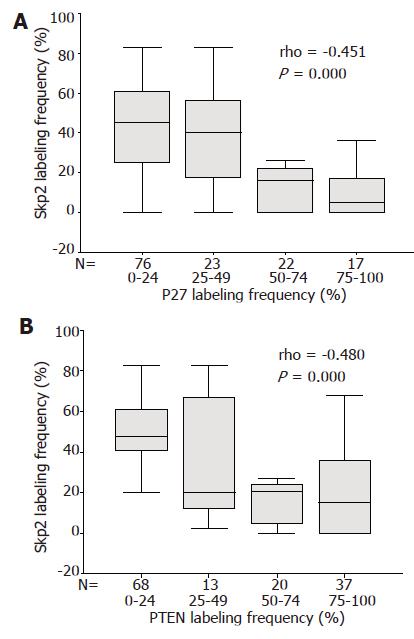
Figure 2 Correlation of Skp2 with p27 (A) and PTEN (B) protein levels.
Each box and the associated bars represent the values of middle 50% and the range of the data respectively. The dark line within a box denotes the median.
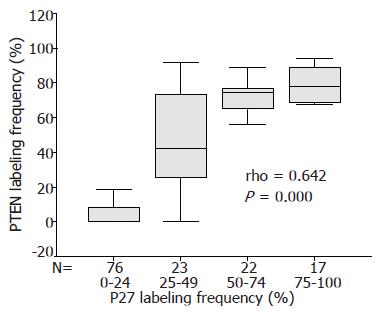
Figure 3 Correlation of p27 and PTEN expression in human gastric carcinoma.
Each box and the associated bars represent the values of middle 50% and the range of the data respectively. The dark line within a box denotes the median.
- Citation: Ma XM, Liu Y, Guo JW, Liu JH, Zuo LF. Relation of overexpression of S phase kinase-associated protein 2 with reduced expression of p27 and PTEN in human gastric carcinoma. World J Gastroenterol 2005; 11(42): 6716-6721
- URL: https://www.wjgnet.com/1007-9327/full/v11/i42/6716.htm
- DOI: https://dx.doi.org/10.3748/wjg.v11.i42.6716


