Copyright
©The Author(s) 2005.
World J Gastroenterol. Nov 14, 2005; 11(42): 6694-6700
Published online Nov 14, 2005. doi: 10.3748/wjg.v11.i42.6694
Published online Nov 14, 2005. doi: 10.3748/wjg.v11.i42.6694
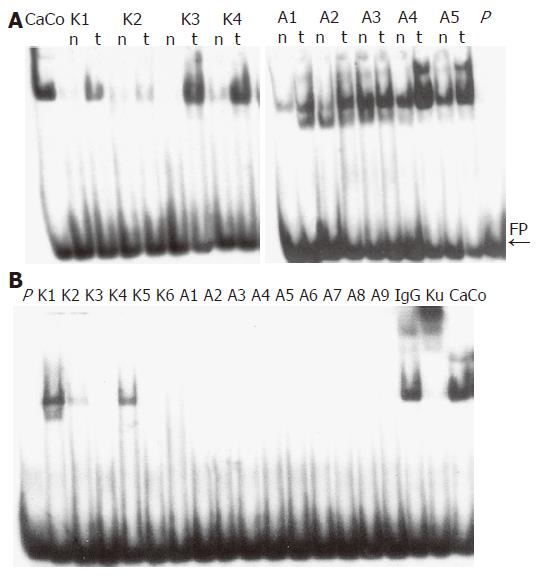
Figure 1 Representative gel shift experiments on nuclear (A) and cytoplasmic (B) extracts from human colon tissues.
Panel A: Normal (n) and pathologic (t) nuclear extracts, obtained from four colorectal cancer (K1-K4) and five adenoma (A1-A5) patients, were analyzed by EMSA as described in "Materials and methods". The positions of Ku band-shifts and of the free probe (FP) are indicated. The binding activity in nuclear extracts from the CaCo-2 cell line (CaCo) has been used as a standard in order to compare the activity in the different gels. Lane P: free probe without protein extract. Panel B: EMSA was performed on pathologic cytoplasmic extracts from colorectal cancer (K1-K6) and adenoma (A1-A9) patients. Lane P: free probe without protein extract.
Figure 2 Changes in Ku70/Ku80 heterodimer DNA binding activity in adenoma (A) and carcinoma (B) compared to matched normal colonic mucosa.
Normal; Tumor; vertical bars indicate standard deviation from the mean of three independent experiments. Adenomas (A) and carcinomas (B) samples characterize by: Group 1 more than 50% increase in DNA binding activity; Group 2 modest increase in binding activity; Group 3 reduced binding activity, 1P<0.000 vs group 1; 2P<0.04 vs group 3; 3P<0.02 vs group 2.
Figure 3 Changes in Ku70 protein levels determined by Western blot analysis in adenoma (A) and carcinoma (B) compared to matched normal colonic mucosa.
Normal; Tumor; vertical bars indicate standard deviation from the mean of three independent experiments. Adenomas (A) and carcinomas (B) are grouped according to the criteria described in Figure 2, 1P<0.000 vs group 1.
Figure 4 Representative immunoblot experiments on nuclear extracts from adenoma cases p70 and p86 protein expression was evaluated by Western blot, on normal (n) and pathologic (t) nuclear extracts from adenoma patients (A1-A7).
The p86 protein was slightly detectable on this and on the other filters analyzed. CaCo-2 cell line nuclear extracts (CaCo) were used as internal standard. Filters were reprobed with anti-β-actin monoclonal antibody to normalize the protein levels.
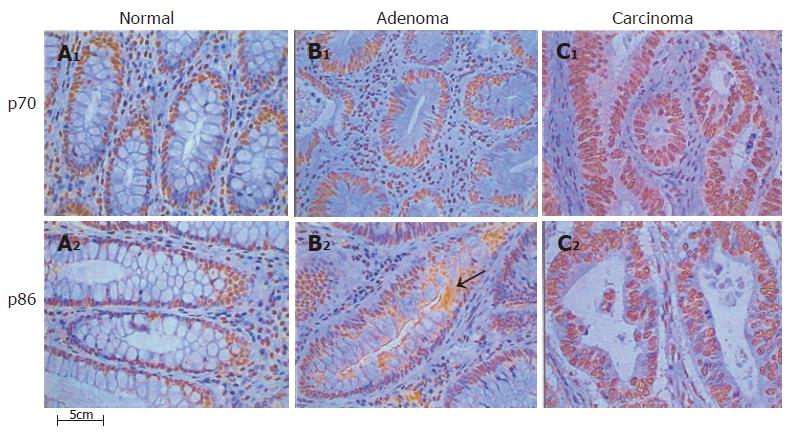
Figure 5 Expression of DNA-PK protein subunits in human colon tissues.
Tissue sections were stained by immunohistochemistry for Ku70 and Ku86 proteins, as described in “Materials and methods”. The increase of positively stained cells is evident in the nuclei of adenoma and carcinoma sections, respect to the normal controls. Ku70 nuclear expression is uniform and displays a higher intensity of staining as compared with p86, as described in the text. No cytoplasmic expression is evident in the normal mucosa sections for any of the protein subunits, whereas it is clearly visible in the pathologic tissues. Ku86 was expressed in the cytoplasm following a speckled pattern of staining, as evident on the adenoma section (arrow). Original magnification ×400. A1-2: Normal; B1-2: Adenoma; C1-2: Carcinoma.
- Citation: Mazzarelli P, Parrella P, Seripa D, Signori E, Perrone G, Rabitti C, Borzomati D, Gabbrielli A, Matera MG, Gravina C, Caricato M, Poeta ML, Rinaldi M, Valeri S, Coppola R, Fazio VM. DNA end binding activity and Ku70/80 heterodimer expression in human colorectal tumor. World J Gastroenterol 2005; 11(42): 6694-6700
- URL: https://www.wjgnet.com/1007-9327/full/v11/i42/6694.htm
- DOI: https://dx.doi.org/10.3748/wjg.v11.i42.6694


