Copyright
©2005 Baishideng Publishing Group Inc.
World J Gastroenterol. Nov 7, 2005; 11(41): 6543-6548
Published online Nov 7, 2005. doi: 10.3748/wjg.v11.i41.6543
Published online Nov 7, 2005. doi: 10.3748/wjg.v11.i41.6543
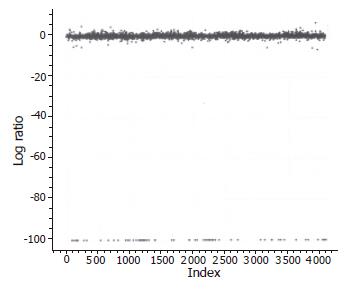
Figure 1 Scatter plots of average ratio/spot label distribution.
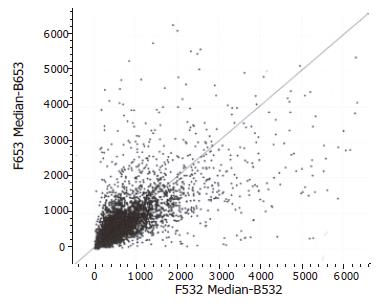
Figure 2 Microarray scatter plot for pancreatic adenocarcinoma mRNA labeled with Cy5 and normal pancreas mRNA labeled with Cy3.
The “sameness line” drawn at a 45° angle denotes a 1:1 ratio of signal intensity between the Cy3 dye (Y axis) and the Cy5 dye (X axis) at each position on the array.
- Citation: Jin G, Hu XG, Ying K, Tang Y, Liu R, Zhang YJ, Jing ZP, Xie Y, Mao YM. Discovery and analysis of pancreatic adenocarcinoma genes using cDNA microarrays. World J Gastroenterol 2005; 11(41): 6543-6548
- URL: https://www.wjgnet.com/1007-9327/full/v11/i41/6543.htm
- DOI: https://dx.doi.org/10.3748/wjg.v11.i41.6543


