Copyright
©2005 Baishideng Publishing Group Inc.
World J Gastroenterol. Nov 7, 2005; 11(41): 6483-6488
Published online Nov 7, 2005. doi: 10.3748/wjg.v11.i41.6483
Published online Nov 7, 2005. doi: 10.3748/wjg.v11.i41.6483
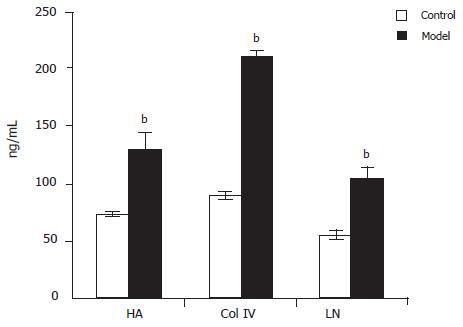
Figure 1 Levels of plasma HA, ColIV and LN in model and control groups bP<0.
01 vs control.
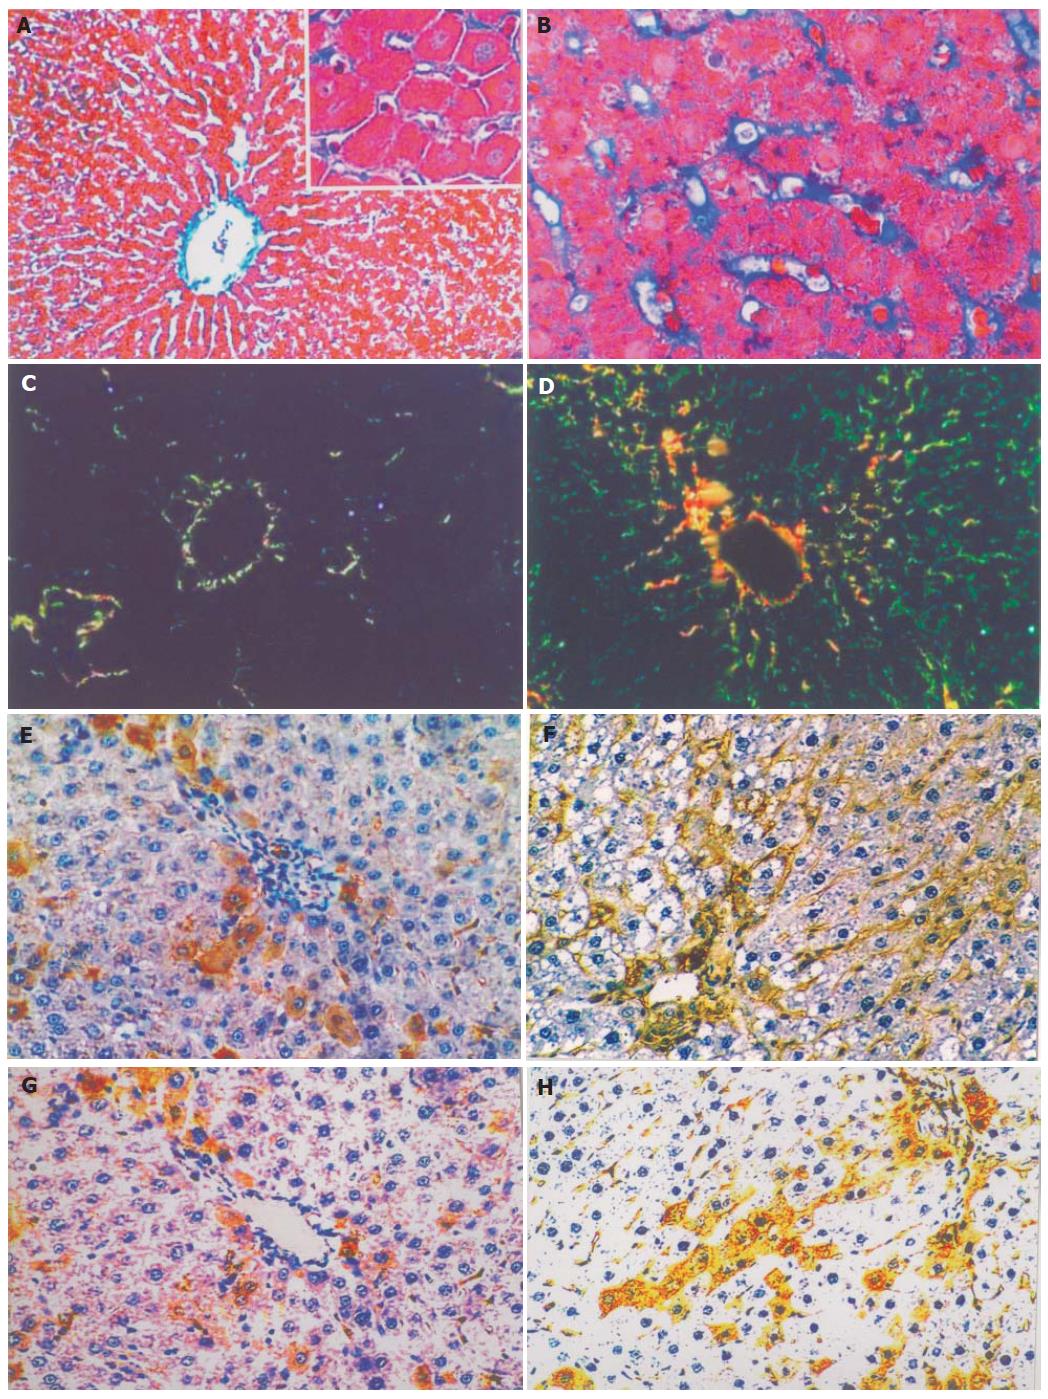
Figure 2 Mallory, Sirius Red and immunohistochemical staining of liver tissue.
A: Mallory staining of normal rat liver tissue, ×200 B: Mallory staining of rat alcoholic fibrosis liver tissue, ×400 C: Sirius Red staining of normal rat liver tissue and polarization microscopy, ×200 D: Sirius Red staining of rat alcoholic fibrosis liver tissue and polarization microscopy, ×200 E: Immunohistochemical staining of the first antibody of ColIV of normal rat liver tissue, ×200 F: Immunohistochemical staining of the first antibody of ColIV rat alcoholic liver fibrosis tissue, ×200 G: Immunohistochemistry staining of the first antibody of LN in normal rat liver tissue, ×200 H: Immunohistochemical staining of the first antibody of LN in rat alcoholic liver fibrosis tissue, ×200.
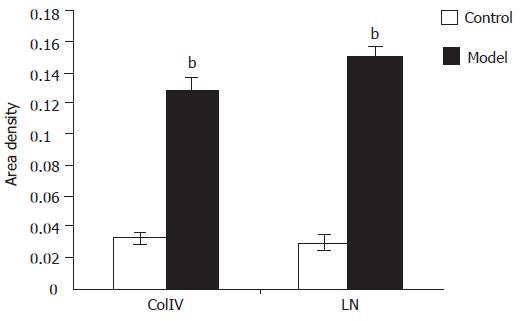
Figure 3 Density of ColIV and LN in positive granule area bP<0.
01 vs control in model and co.
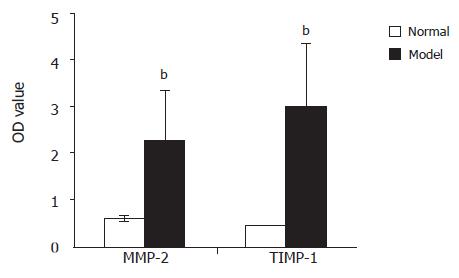
Figure 4 Comparison of MMP-2 and TIMP-1 protein expression in hepatic non-parenchymal cells between model and control groupsbP<0.
01, model group vs control group; cP<0.05, TIMP-1 vs MMP-2.
- Citation: Li J, Niu JZ, Wang JF, Li Y, Tao XH. Pathological mechanisms of alcohol-induced hepatic portal hypertension in early stage fibrosis rat model. World J Gastroenterol 2005; 11(41): 6483-6488
- URL: https://www.wjgnet.com/1007-9327/full/v11/i41/6483.htm
- DOI: https://dx.doi.org/10.3748/wjg.v11.i41.6483


