Copyright
©The Author(s) 2005.
World J Gastroenterol. Nov 7, 2005; 11(41): 6422-6428
Published online Nov 7, 2005. doi: 10.3748/wjg.v11.i41.6422
Published online Nov 7, 2005. doi: 10.3748/wjg.v11.i41.6422
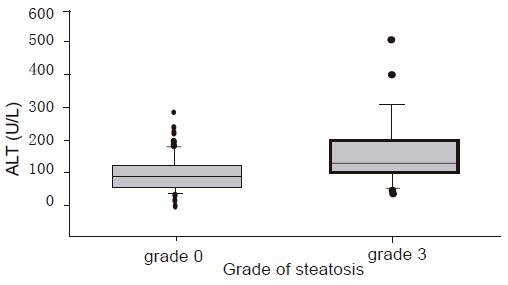
Figure 1 Differences of ALT levels in CH-C patients without steatosis (n = 52, grade 0) and with severe steatosis (n = 28, grade 3) (P < 0.
01).
Figure 2 Correlation between ALT levels and HAI/HAI+steatosis in CH-C patients.
A: without steatosis (n = 52, r = 0.556, P < 0.00002); B: with steatosis (n = 90, NS); C: in CH-C patients (n = 142, r = 0.41, P < 0.00001).
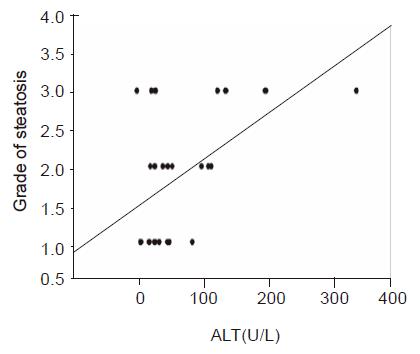
Figure 3 Correlation between ALT levels and grade of steatosis in patients without CH-C (n = 28, r = 0.
533, P<0.005).
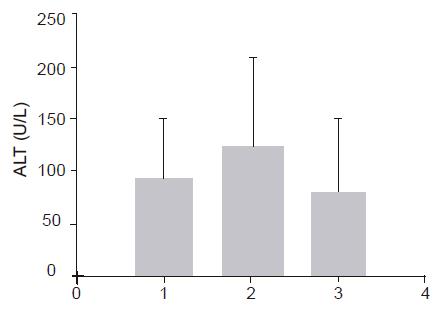
Figure 4 ALT levels in CH-C patients without and with steatosis and in patients with steatosis without CH-C.
Bar 1: CH-C patients without steatosis (n = 52). Bar 2: CH-C patients with steatosis (n = 90). Bar 3: Patients with liver steatosis without CH-C (n = 28) Bar 1 P<0.02 vs Bar 2. Bar 2 P<0.02 vs Bar 3.
Figure 5 Triglyceride levels in CH-C female patients.
A: With steatosis compared to outpatients with alcoholic habits;
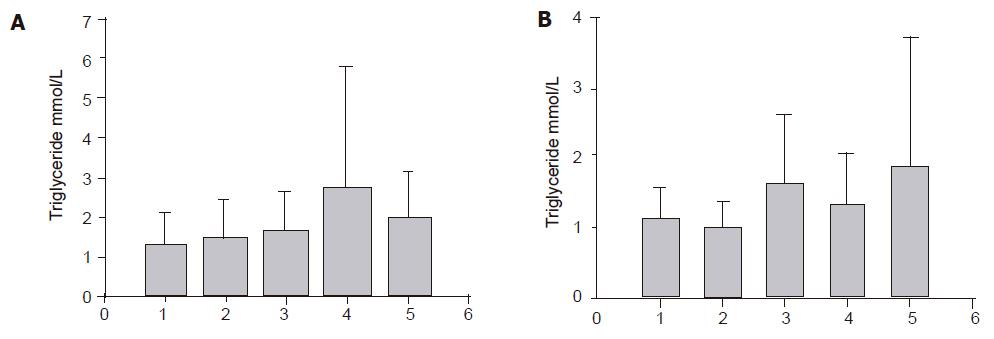
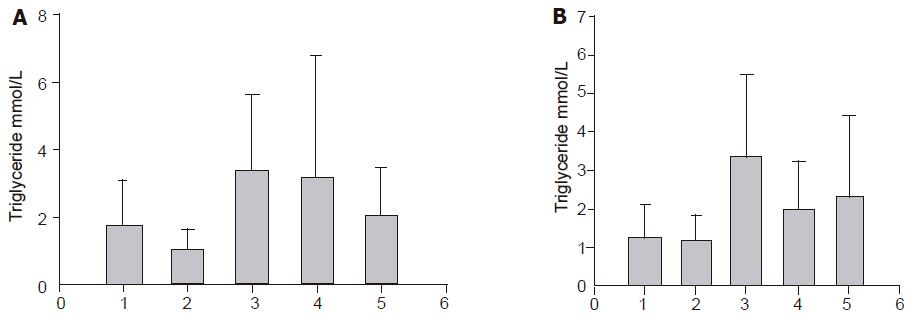
Figure 6 Triglyceride levels in CH-C male patients.
A: Steatosis compared to outpatients with alcoholic habits; Bar 1: CH-C young male patients with steatosis (n = 29, average age 37 years); Bar 2: CH-C elderly male patients with steatosis (n = 15, average age 52 years); Bar 3: Male patients with liver steatosis (n = 16); Bar 4: Male outpatients with alcoholic habits (n = 86, age 37 years); Bar 5: Male outpatients with alcoholic habits (n = 190, age 52 years). Bar 1 P<0.0001 vs Bar 4. Bar 2 P<0.0001 vs Bar 4. Bar 4 P<0.0001 vs Bar 5. B: Without steatosis compared to outpatients without alcoholic habits. Bar 1: CH-C young male patients without steatosis (n = 24, age 37 years); Bar2: CH-C elderly male patients without steatosis (n = 11, average age 49 years); Bar 3: Male patients with liver steatosis (n = 16); Bar 4: Male outpatients without alcoholic habits (n = 60, age 37 years); Bar 5: Male outpatients without alcoholic habits (n = 509, age 49 years). Bar 1 and 2 P<0.0005 vs Bar 3. Bar 3 P<0.0005 vs Bar 4.
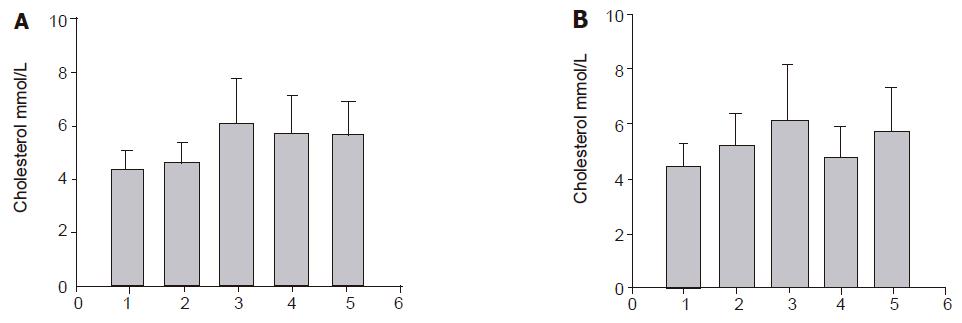
Figure 7 Cholesterol levels in CH-C female patients.
A: With steatosis compared to outpatients with alcoholic habits; Bar 1: CH-C young female patients with steatosis (n = 26, average age 38 years); Bar 2: CH-C elderly female patients with steatosis (n = 20,average age 52 years); Bar 3: female patients with liver steatosis (n = 12); Bar 4: female outpatients with alcoholic habits (n = 8, age 38 years); Bar 5: female outpatients with alcoholic habits (n = 16, age 52 years). Bar 1 NS vs Bar 2. Bar 1 and 2 P<0.0001 vs Bar 3. Bar 1 P<0.0001 vs Bar 4. Bar 1 and 2 P<0.0001 vs Bar 5. B: Without steatosis compared to outpatients without alcoholic habits. Bar 1: CH-C young female patients without steatosis (n = 10, average age 29 years); Bar 2: CH-C elderly female patients without steatosis (n = 7, average age 53 years); Bar 3: female patients with liver steatosis (n = 12); Bar 4: female outpatients without alcoholic habits (n = 125, age 29 years); Bar 5: female outpatients without alcoholic habits (n = 803, age 53 years). Bar 1 NS vs Bar 2. Bar 1 P < 0.0001 vs Bar 3. Bar 1 P<0.0001 vs Bar 5. Bar 3 P < 0.0001 vs Bar 4.
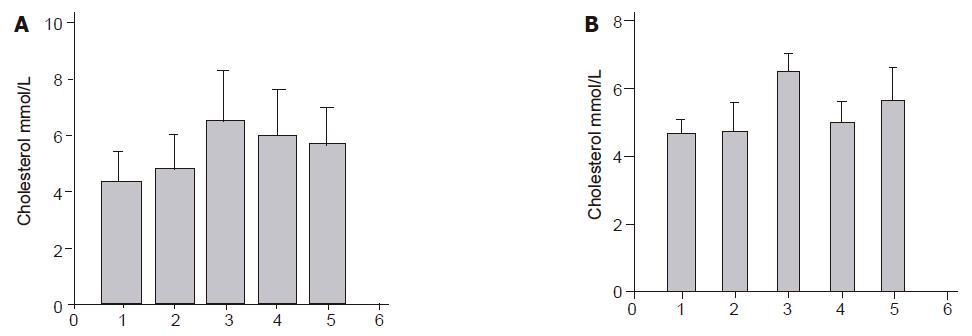
Figure 8 Cholesterol levels in CH-C male patients.
A: With steatosis compared to outpatients with alcoholic habits; Bar 1: CH-C young male patients with steatosis (n = 29, average age 37 years); Bar 2: CH-C elderly male patients with steatosis (n = 15, average age 51 years); Bar 3: male patients with liver steatosis (n = 16); Bar 4: male outpatients with alcoholic habits (n = 86, age 37 years); Bar 5: male outpatients with alcohollic habits (n = 190, age 51 years). Bar 1NS vs Bar 2. Bar 1 and 2 P<0.0001 vs Bar 3. Bar 1 and 2 P<0.0001 vs Bar 4. B: Without steatosis compared to outpatients without alcoholic habits. Bar 1: CH-C young male patients without steatosis (n = 24, average age 34 years); Bar 2: CH-C elderly male patients without steatosis (n = 11, average age 49 years); Bar 3: male patients with liver steatosis (n = 16); Bar 4: male outpatients without alcoholic habits (n = 60, age 34 years); Bar 5:Male outpatients without alcoholic habits (n = 509, age 49 years). Bar1NS vs Bar 2. Bar 1 and 2 P<0.001 vs Bar 3. Bar 1 and 2 P<0.001 vs Bar 5. Bar 3 P<0.001 vs Bar 4.
- Citation: Jármay K, Karácsony G, Nagy A, Schaff Z. Changes in lipid metabolism in chronic hepatitis C. World J Gastroenterol 2005; 11(41): 6422-6428
- URL: https://www.wjgnet.com/1007-9327/full/v11/i41/6422.htm
- DOI: https://dx.doi.org/10.3748/wjg.v11.i41.6422


