Copyright
©The Author(s) 2005.
World J Gastroenterol. Oct 14, 2005; 11(38): 5978-5983
Published online Oct 14, 2005. doi: 10.3748/wjg.v11.i38.5978
Published online Oct 14, 2005. doi: 10.3748/wjg.v11.i38.5978
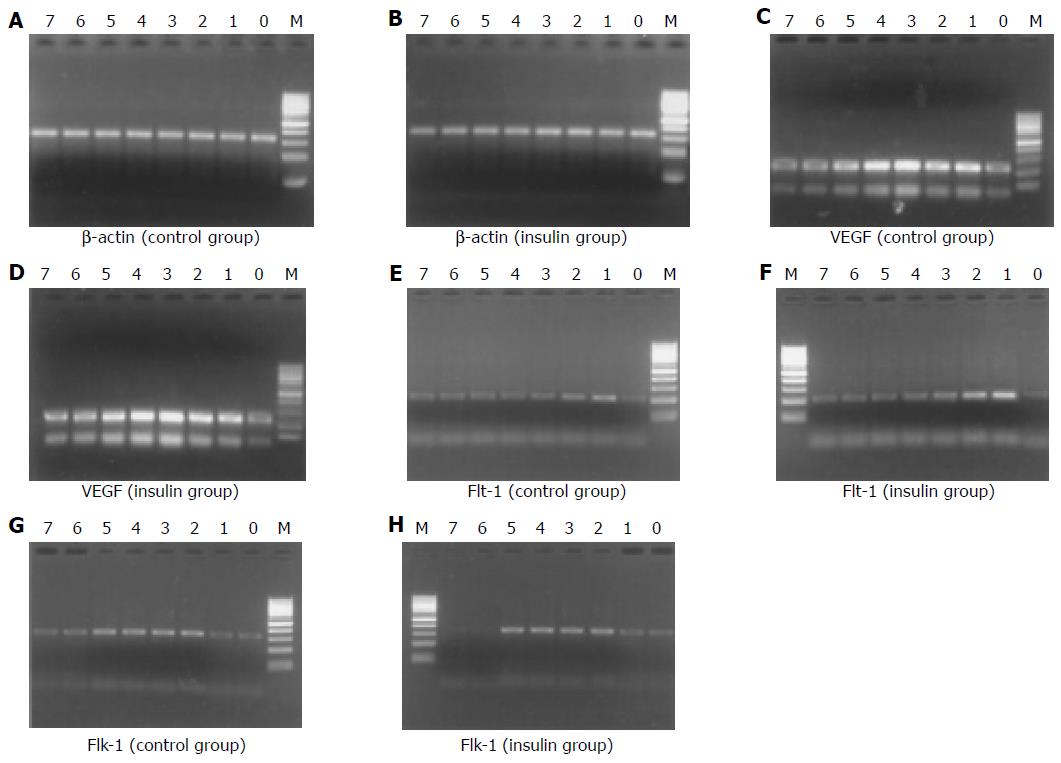
Figure 1 RT-PCR results of VEGF, Flt-1, and Flk-1 mRNA expressions in liver of different groups.
M: 100-bp DNA ladder (uppehttp://www.wjgnet.com/1007-9327/11/5978.pdfr to lower: 1 000, 900, 800, 700, 600, 500, 400, 300, 200, and 100 bp); lane 0: 0 h; lane 1: 24 h; lane 2: 48 h; lane 3: 72 h; lane 4: 96 h; lane 5: 120 h; lane 6: 144 h; lane 7: 168 h.
Figure 2 VEGF (A), Flt-1 (B), and Flk-1 (C) mRNA expressions after 70% hepatectomy in rats by RT-PCR.
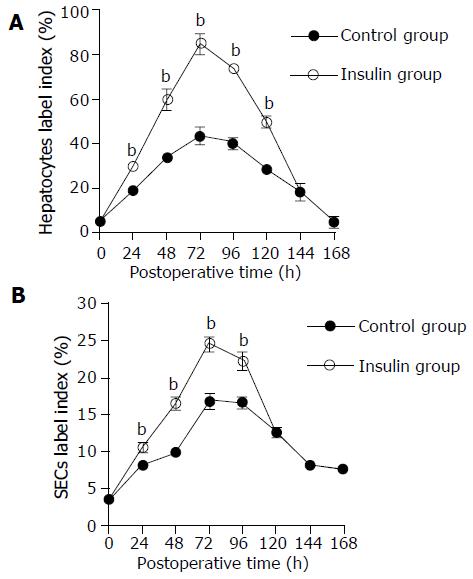
Figure 3 PCNA LI of hepatocytes (A) and SECs (B) after 70% hepatectomy in rats.
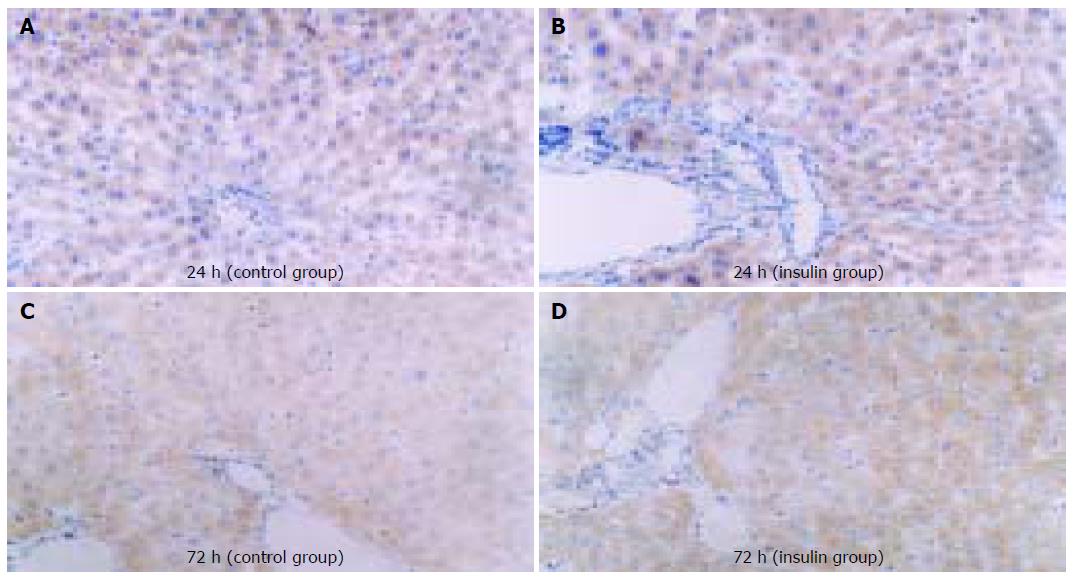
Figure 4 Expression of VEGF protein at 24 h in control group (A) and insulin group (B), at 72 h in control group (C), and insulin group (D).
- Citation: Qiao JG, Wu L, Lei DX, Wang L. Insulin promotes sinusoidal endothelial cell proliferation mediated by upregulation of vascular endothelial growth factor in regenerating rat liver after partial hepatectomy. World J Gastroenterol 2005; 11(38): 5978-5983
- URL: https://www.wjgnet.com/1007-9327/full/v11/i38/5978.htm
- DOI: https://dx.doi.org/10.3748/wjg.v11.i38.5978


