Copyright
©2005 Baishideng Publishing Group Inc.
World J Gastroenterol. Sep 21, 2005; 11(35): 5444-5449
Published online Sep 21, 2005. doi: 10.3748/wjg.v11.i35.5444
Published online Sep 21, 2005. doi: 10.3748/wjg.v11.i35.5444
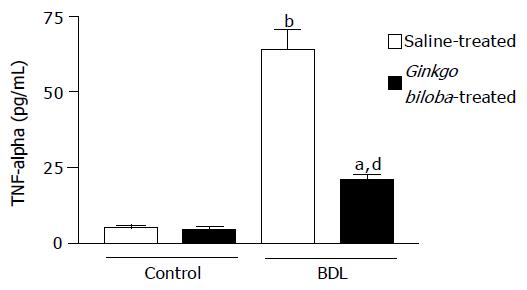
Figure 1 Serum TNF-α levels of the control, Ginkgo-biloba-treated, saline-treated BDL and Ginkgo-biloba-treated BDL groups.
aP<0.05, bP<0.001 vs control; dP<0.001 vs saline-treated BDL group.
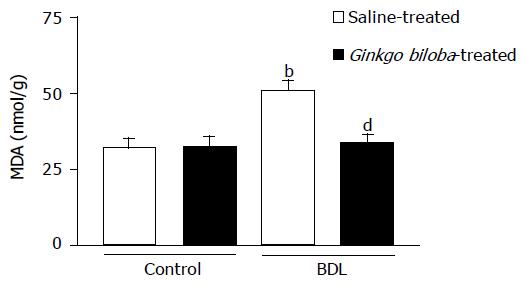
Figure 2 Liver MDA levels of the control, Ginkgo-biloba-treated, saline-treated-BDL, and Ginkgo-biloba-treated BDL groups.
bP<0.01 vs control; dP<0.01 vs saline-treated BDL group.
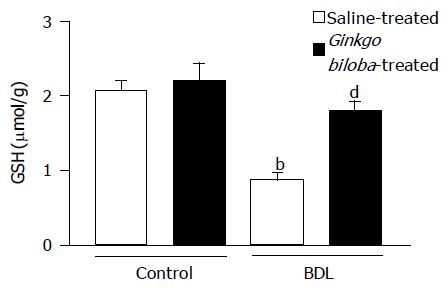
Figure 3 Liver GSH levels of the control, Ginkgo-biloba-treated, saline-treated-BDL, and Ginkgo-biloba-treated BDL groups.
bP<0.001 vs control; dP<0.001 vs saline-treated BDL group.
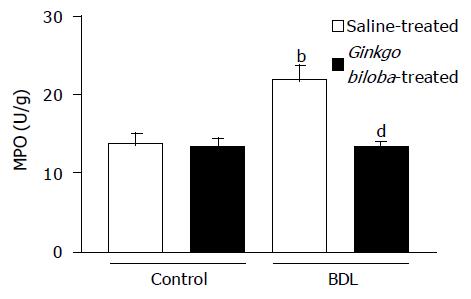
Figure 4 Liver MPO activities of the control, Ginkgo-biloba-treated, saline-treated BDL, and Ginkgo-biloba-treated BDL groups.
bP<0.01 vs control; dP<0.01 vs saline-treated BDL group.
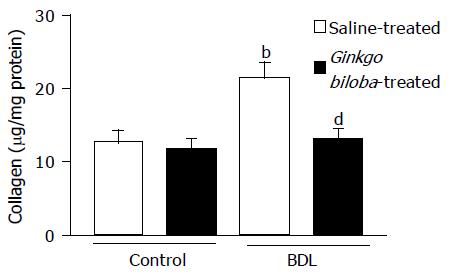
Figure 5 Liver collagen levels of the control, Ginkgo-biloba-treated, saline-treated-BDL, and Ginkgo-biloba-treated BDL groups.
bP<0.01 vs control; dP<0.01 vs saline-treated BDL group.
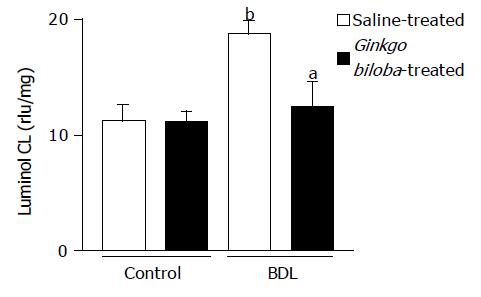
Figure 6 Liver luminol CL values of the control, Ginkgo-biloba-treated, saline-treated BDL, and Ginkgo-biloba-treated BDL groups.
aP<0.05 vs saline-treated BDL group; bP<0.01 vs control.
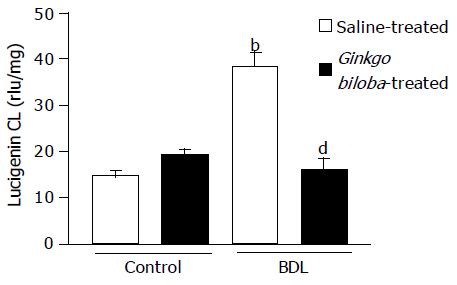
Figure 7 Liver lucigenin CL values of the control, Ginkgo-biloba-treated, saline-treated BDL, and Ginkgo-biloba-treated BDL groups.
bP<0.001 vs control; dP<0.001 vs saline-treated BDL group.
- Citation: Þener G, Kabasakal L, Yüksel M, Gedik N, Alican Ý. Hepatic fibrosis in biliary-obstructed rats is prevented by Ginkgo biloba treatment. World J Gastroenterol 2005; 11(35): 5444-5449
- URL: https://www.wjgnet.com/1007-9327/full/v11/i35/5444.htm
- DOI: https://dx.doi.org/10.3748/wjg.v11.i35.5444


