Copyright
©The Author(s) 2005.
World J Gastroenterol. Sep 7, 2005; 11(33): 5142-5150
Published online Sep 7, 2005. doi: 10.3748/wjg.v11.i33.5142
Published online Sep 7, 2005. doi: 10.3748/wjg.v11.i33.5142
Figure 1 Trans-10,cis-12 (t10c12) CLA abrogates the growth stimulatory effect of heregulin (HRG )-β.
HT-29 cells were plated in 24-well plates at 50000 cells/well in DMEM/F12 supplemented with 10% fetal bovine serum. A day later, the monolayers were serum-starved with serum-free DMEM/F12 supplemented with 5 μg/mL transferrin, 0.1 mg/mL BSA, and 5 ng/mL selenium for 24 h. After serum-starvation, cells were incubated in serum-free medium in the absence or presence of 4 μmol/L t10c12 (A) or c9t11 (B) with or without 20 ng/mL HRG-β. Cell numbers were estimated by the MTT assay. Each bar represents the mean±SE (n = 6). Comparisons between groups that yielded significant differences are indicated by different letters above each bar. For example, aP<0.05 vs 0 μmol/L t10c12, cP<0.05 vs 0 μmol/L t10c12 + HRGβ, eP<0.05 vs 4 μmol/L t10c12.
Figure 2 Effect of HRG-β and/or t10c12 on DNA synthesis and apoptosis of HT-29 cells.
HT-29 cells were cultured and treated with 4 μmol/L t10c12 in the absence or presence of 20 ng/mL HRG-β. A: To estimate DNA synthesis, [3H]thymidine incorporation into DNA was measured. B: To measure apoptosis, the cells were stained with 7-amino-actinomycin D (7-AAD) and Annexin V, and then analyzed by flow cytometry. The number of early apoptotic cells is expressed as a percentage of total cell number. Each bar represents the mean±SE from six independent experiments. Comparisons between groups that yielded significant differences are indicated by different letters above each bar. For example, aP<0.05 vs 0 μmol/L t10c12, cP<0.05 vs 0 μmol/L t10c12 + HRGβ, eP<0.05 vs 4 μmol/L t10c12.
Figure 3 Effect of t10c12 on the protein expression of ErbB1, ErbB2, ErbB3, HRG, and the p85 subunit of PI3K.
HT-29 cells were treated with various concentrations of t10c12 for 3 d. Cell lysates were subjected to immunoblotting with an antibody against ErbB1, ErbB2, ErbB3, p85 subunit of PI3K, HRG, or β-actin. A: Photographs of chemiluminescent detection of the blots, which were representative of three independent experiments, are shown; B: Quantitative analysis of immunoblots. The relative abundance of each band was estimated by densitometric scanning of the exposed films. Each bar represents the mean±SE (n = 3). Comparisons between groups that yielded significant differences are indicated by different letters above each bar. For example, aP<0.05 vs 0 μmol/L t10c12, cP<0.05 vs 1 μmol/L t10c12, eP<0.05 vs 2 μmol/L t10c12.
Figure 4 Effect of c9t11 on the protein expression of ErbB1, ErbB2, ErbB3, HRG, and the p85 subunit of PI3K.
HT-29 cells were treated with various concentrations of c9t11 for 3 d. Cell lysates were subjected to immunoblotting with an antibody against ErbB1, ErbB2, ErbB3, p85 subunit of PI3K, HRG, or β-actin. A: Photographs of chemiluminescent detection of the blots, which were representative of three independent experiments, are shown. B: Quantitative analysis of immunoblots. The relative abundance of each band was estimated by densitometric scanning of the exposed films. Each bar represents the mean±SE (n = 3).
Figure 5 Effect of t10c12 on ErbB1, ErbB2, and ErbB3 transcripts.
HT-29 cells were treated with various concentrations of t10c12 for 3 d. Total RNA was isolated and RT-PCR was performed as described in Materials and methods. A: Photographs of the ethidium bromide-stained gel, which were representative of three independent experiments, are shown; B: Quantitative analysis of mRNAs. The relative abundance of each band was estimated by densitometric scanning of the exposed films. Each bar represents the mean±SE (n = 3). Comparisons between groups that yielded significant differences are indicated by different letters above each bar. For example, aP<0.05 vs 0 μmol/L t10c12, cP<0.05 vs 1 μmol/L t10c12, eP<0.05 vs 2 μmol/L t10c12.
Figure 6 Effect of c9t11 on ErbB1, ErbB2, and ErbB3 transcripts.
HT-29 cells were treated with various concentrations of c9t11. Total RNA was isolated and RT-PCR was performed as described in Materials and methods. A: Photographs of the ethidium bromide-stained gel, which were representative of three independent experiments, are shown; B: Quantitative analysis of mRNAs. The relative abundance of each band was estimated by densitometric scanning of the exposed films. Each bar represents the mean±SE (n = 3).
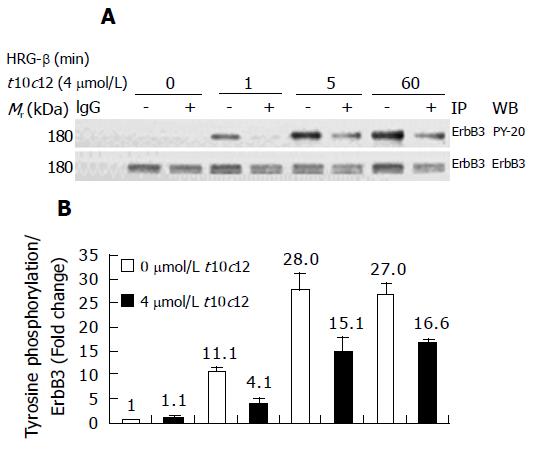
Figure 7 Effect of t10c12 on HRG-β-induced tyrosine phosphorylation of ErbB3 in HT-29 cells.
Cells were treated in the absence or presence of 4 μmol/L t10c12 for 3 d and lysed without stimulation (0) or after 1, 5, or 60 min of stimulation with HRG-β. Cell lysates were incubated with an anti-ErbB3 antibody and the immune complexes were precipitated with protein A-Sepharose. The immunoprecipitated proteins were analyzed by Western blotting with antibodies against phosphotyrosine or ErbB3. A: Photographs of chemiluminescent detection of the blots, which were representative of three independent experiments, are shown; B: The relative abundance of each band was estimated by densitometric scanning of the exposed films. Each bar represents the mean±SE (n = 3).
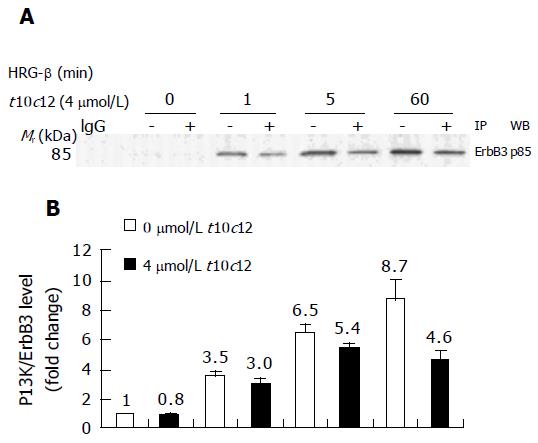
Figure 8 Effect of t10c12 on HRG-β-induced recruitment of the p85 subunit of PI3K to ErbB3 in HT-29 cells.
Immunoprecipitation was performed with an anti-ErbB3 antibody and protein A-Sepharose as described above. The immunoprecipitated proteins were analyzed by Western blotting with an antibody against the p85 PI3K subunit. A: A photograph of chemiluminescent detection of the blot, which was representative of three independent experiments, is shown. B: The relative fold change in p85 to its own ErbB3 band on Western blots. Each bar represents the mean±SE (n = 3).
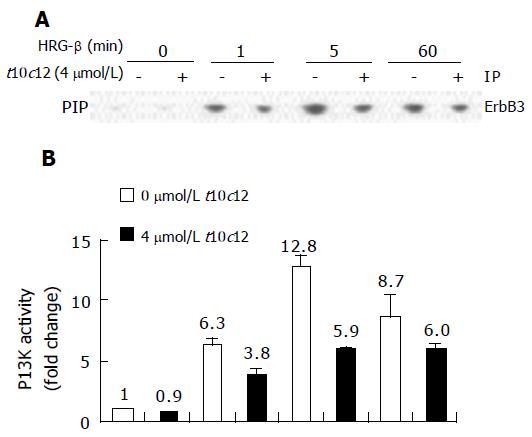
Figure 9 Effect of t10c12 and/or HRG-β on ErbB3-associated PI3K activity.
Cells were treated, and lysates were prepared and immunoprecipitated with an anti-ErbB3 antibody as described in Figure 8. The immune complexes were incubated with phosphatidylinositol and [g-32P]ATP. Phosphatidylinositol 3-phosphate (PIP) generated by immunoprecipitated PI3K was separated by thin-layer chromatography (TLC). A: An autoradiograph of the TLC plate, which was representative of three independent experiments, is shown; B: Relative fold changes in PIP. The radioactive PIP signals were quantitated by densitometry. Each bar represents the mean±SE (n = 3).
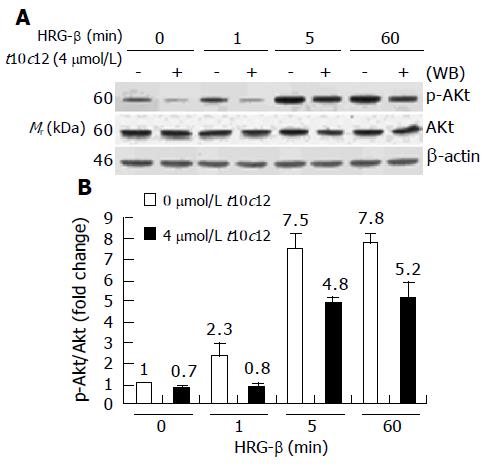
Figure 10 Effect of t10c12 on HRG-β-induced Akt activation.
Similar protein samples as those in Figure 8 were analyzed by immunoblotting with anti-phospho-Ser473 Akt (p-Akt) or whole Akt protein antibodies. A: Photographs of chemiluminescent detection of the blots, which were representative of three independent experiments, are shown; B: Quantitative analysis of immunoblots. The relative fold change in p-Akt to its own Akt control band on Western blots was quantitated by densitometric analysis. Each bar represents the mean±SE (n = 3).
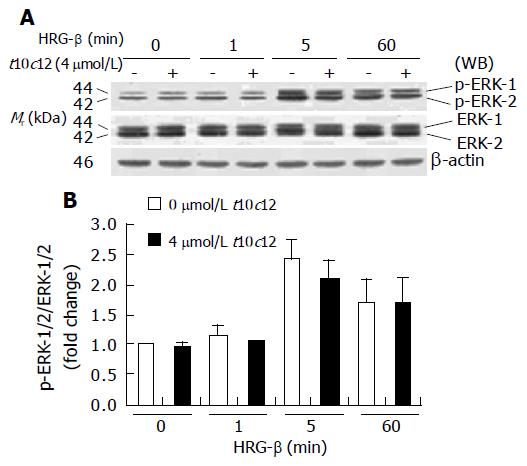
Figure 11 Effect of t10c12 on HRG-β-induced ERK-1/2 activation in HT-29 cells.
Similar protein samples as those in Figure 8 were analyzed by immunoblotting with p-ERK-1/2 or whole ERK-1/2 antibodies. A: Photographs of chemiluminescent detection of the blots, which were representative of three independent experiments, are shown; B: Quantitative analysis of immunoblots. The relative fold change in p-ERK-1/2 to its own ERK-1/2 control band on Western blots was quantitated by densitometric analysis. Each bar represents the mean±SE (n = 3).
- Citation: Cho HJ, Kim WK, Jung JI, Kim EJ, Lim SS, Kwon DY, Park JHY. Trans-10,cis-12, not cis-9,trans-11, conjugated linoleic acid decreases ErbB3 expression in HT-29 human colon cancer cells. World J Gastroenterol 2005; 11(33): 5142-5150
- URL: https://www.wjgnet.com/1007-9327/full/v11/i33/5142.htm
- DOI: https://dx.doi.org/10.3748/wjg.v11.i33.5142


