Copyright
©The Author(s) 2005.
World J Gastroenterol. Jul 28, 2005; 11(28): 4375-4381
Published online Jul 28, 2005. doi: 10.3748/wjg.v11.i28.4375
Published online Jul 28, 2005. doi: 10.3748/wjg.v11.i28.4375
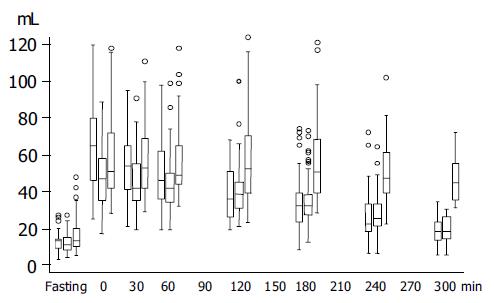
Figure 1 (PDF) Box-and-whiskers plots of gastric antral volume before (fasting), immediately (0) at 30- and 60-min intervals, after the end of the ingestion of a standard meal, in controls (left) and in dyspeptic patients with normal (middle) and delayed (right) gastric emptying.
The boxes at each time unit extend from the 25th percentile (x[25]) to the 75th percentile [x[75], i.e., the interquartile range (IQ)]; the lines inside the boxes represent the median values. The line emerging from the boxes (i.e., the "whiskers") extend to the upper and lower adjacent values. The upper adjacent value is defined as the largest data point≤x[75]+1.5 X IQ, and the lower adjacent value is defined as the smallest data point ≥x[25]-1.5 X IQ. Observed values more extreme than the adjacent values, if any, are individually plotted (circles). The widths of the boxes are proportional to the number of observations available at each time unit.
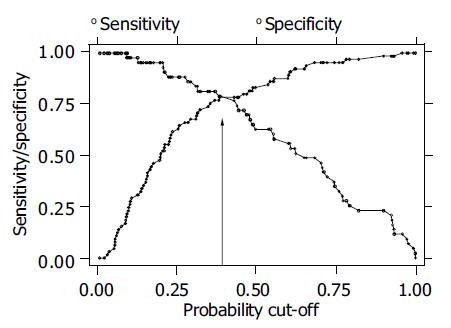
Figure 2 (PDF) Proportion of patients with delayed and normal gastric emptying who where correctly classified on the basis of their predicted probabilities obtained from the estimated coefficients of the second model reported in Table 2 (i.
e., sensitivity and specificity, respectively). These proportions are plotted with cut-off levels varying between 0 and 1 (see “lsens” function in Ref.[37]). As expected, when the cut-off value is close to zero all individuals with an actual delayed gastric emptying will be correctly classified and thus having a very high sensitivity. In contrast, with very low cut-off values also those having a normal gastric emptying will be classified as “delayed” by the model and thus having a very low specificity. As the cut-off value used for classification increases, the model will provide the worst performances for the sensitivity and the best performances for the specificity. Circles identify sensitivity and squares specificity. Arrow indicates the probability cut-off value of 0.398, i.e., the estimated prevalence of delayed gastric emptying in this sample.
- Citation: Pallotta N, Pezzotti P, Calabrese E, Baccini F, Corazziari E. Relationship between gastrointestinal and extra-gastrointestinal symptoms and delayed gastric emptying in functional dyspeptic patients. World J Gastroenterol 2005; 11(28): 4375-4381
- URL: https://www.wjgnet.com/1007-9327/full/v11/i28/4375.htm
- DOI: https://dx.doi.org/10.3748/wjg.v11.i28.4375


