©2005 Baishideng Publishing Group Inc.
World J Gastroenterol. Jun 14, 2005; 11(22): 3431-3440
Published online Jun 14, 2005. doi: 10.3748/wjg.v11.i22.3431
Published online Jun 14, 2005. doi: 10.3748/wjg.v11.i22.3431
Figure 1 MSCs are induced to differentiate into osteoblasts and stained red color by Chinalizarin (A).
Under adipogenic conditions, MSCs accumulate lipid vacuoles, which are positively stained by Oil Red O assay (B). Under neurogenic conditions, MSCs differentiate into neuronal-like cells and stained positively for NSE by immunocytochemical analysis (C). (Original magnification, ×200.)
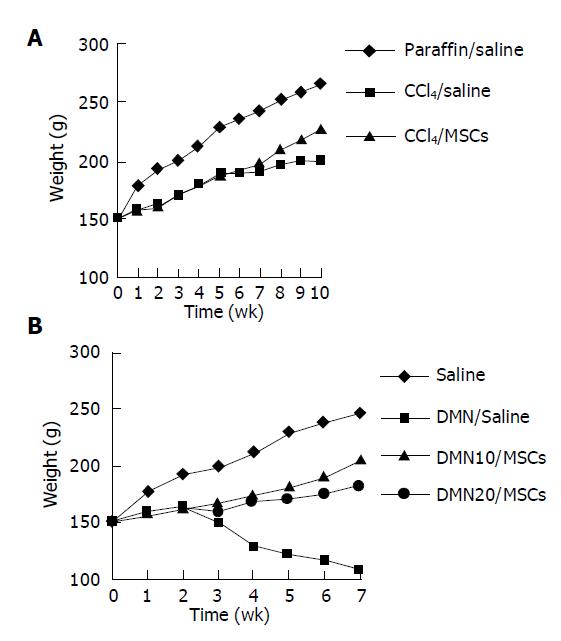
Figure 2 Average weekly weight of rats induced with CCl4 (A) or DMN (B).
A: Paraffin/saline, n = 10; CCl4/saline, n = 10-8; CCl4/MSCs, n = 10-9; B: saline, n = 10; DMN/saline, n = 40-4; DMN10/MSCs, n = 10-8; DMN20/MSCs, n = 10-6.
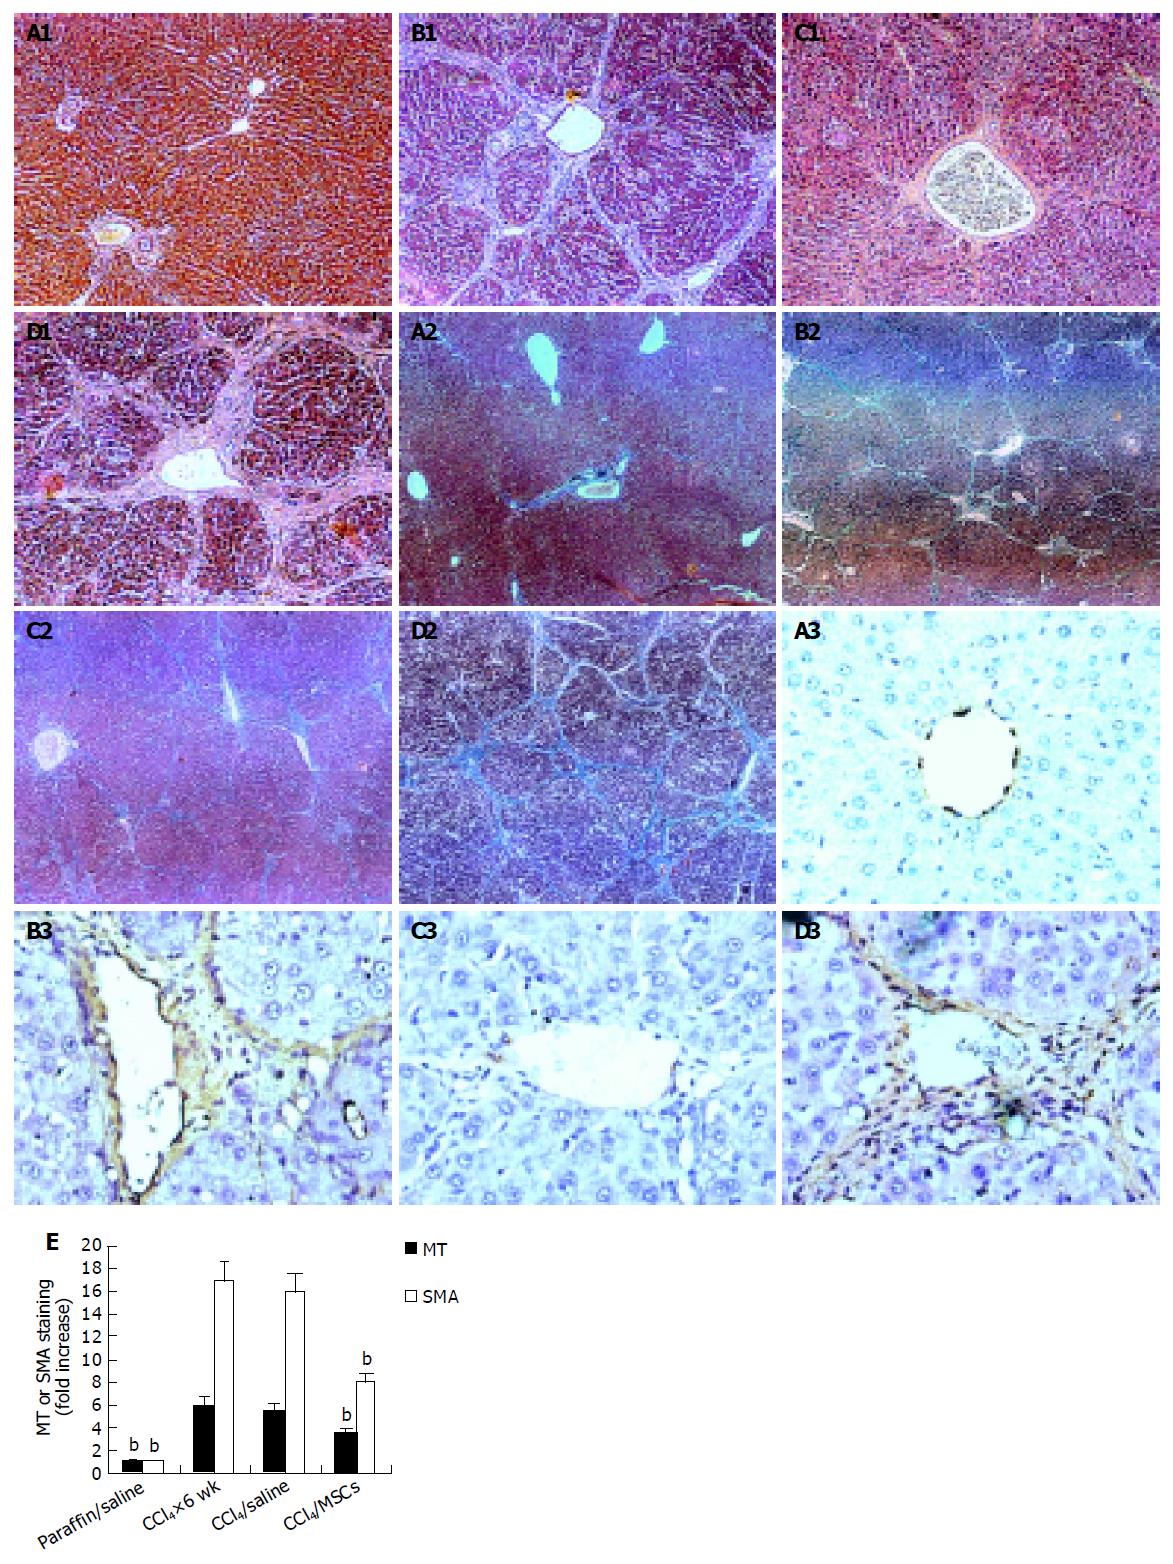
Figure 3 Analysis of liver histopathology and immunohistochemistry in rats induced with CCl4.
A: Paraffin/saline; B: CCl4×6 wk; C: CCl4/MSCs; D: CCl4/saline; 1: HE staining, original magnification ×100; 2: MT staining, original magnification ×40; 3: immunohistochemistry for α-SMA, DAB staining, original magnification ×400; E: MT and α-SMA staining was quantified using IBAS 2.5 software. Data represent the fold-increase in positive staining vs paraffin/saline. Values are presented as mean±SD. bP<0.01 vs CCl4/saline. Not significantly different between values of CCl4/saline and CCl4×6 wk.
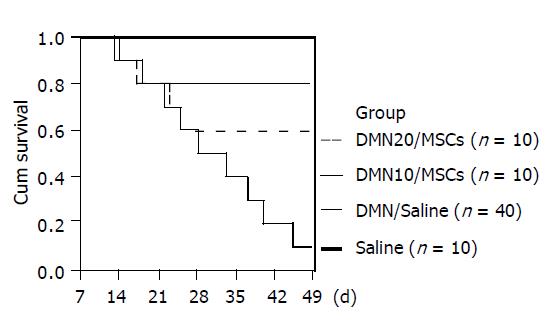
Figure 4 Survival of rats in control group and DMN-induced group with or without MSCs administration.
Analysis of survival was conducted by a log-rank test based on the Kaplan–Meier method.
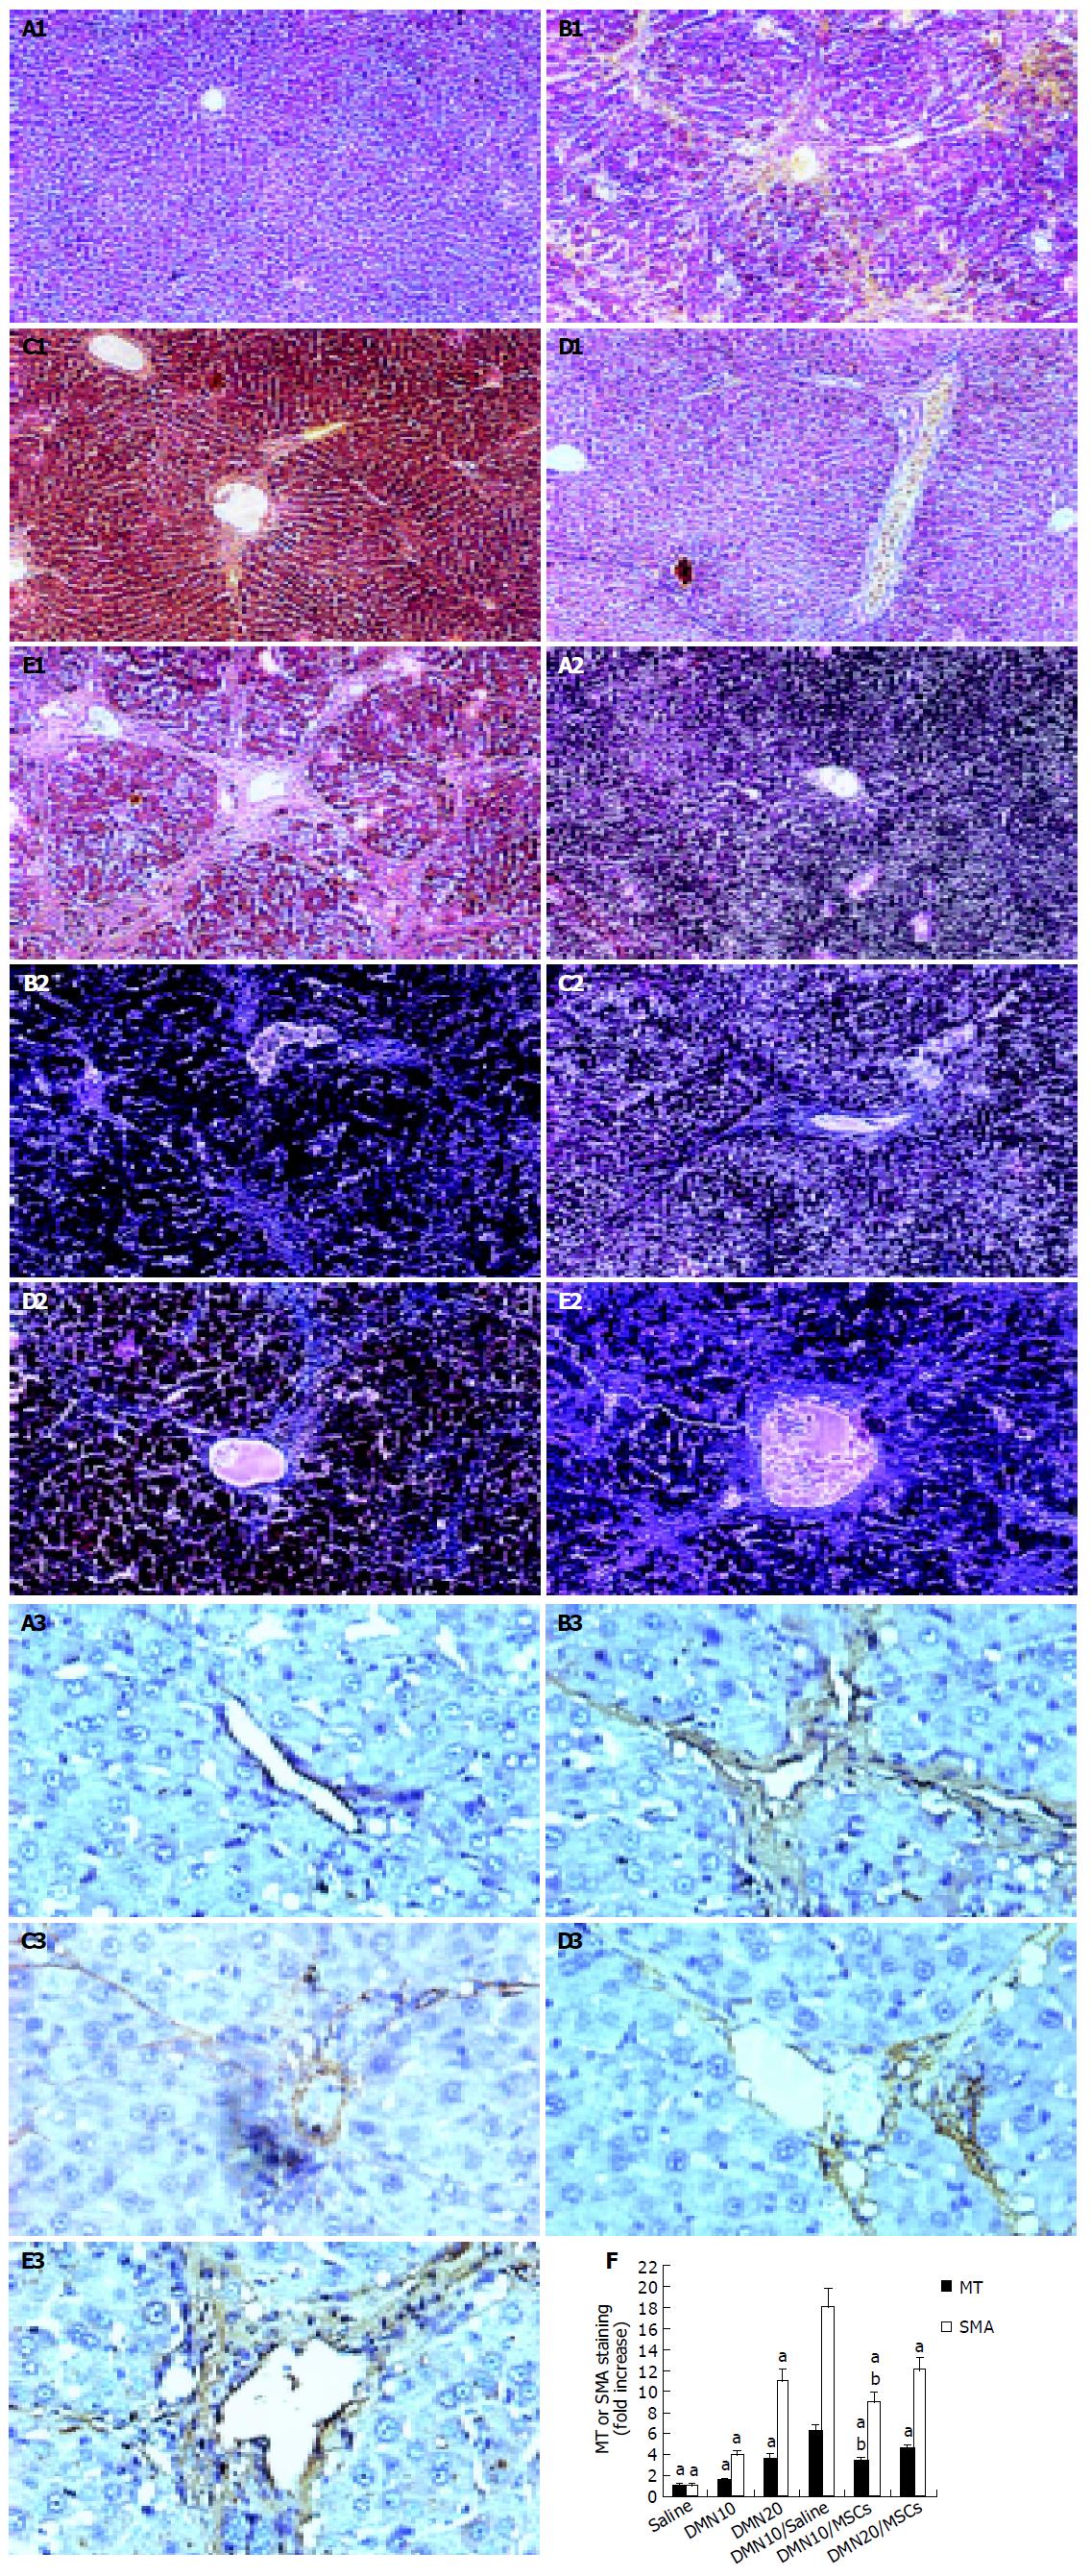
Figure 5 Analysis of liver histopathology and immunohistochemistry in rats induced with DMN.
A: DMN10; B: DMN20; C: DMN10/MSCs; D: DMN20/MSCs; E: DMN10/saline; 1: HE staining, original magnification ×100; 2: MT staining, original magnification ×100; 3: immunohistochemistry for α-SMA, DAB staining, original magnification ×400; F: MT and α-SMA staining was quantified using IBAS 2.5 software. Data represent the fold-increase in positive staining vs saline. Values are presented as mean±SD. aP<0.05 vs DMN20/MSCs, bP<0.01 vs DMN10/saline respectively.
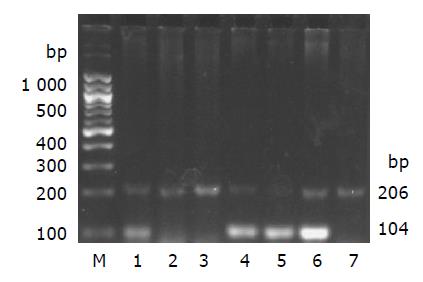
Figure 6 PCR signals of sry gene and β-actin gene in liver of rats.
sry, 104 bp; β-actin, 206 bp; M: 100-bp DNA maker; lane 1: CCl4/MSCs; lane 2: CCl4×6 wk; lane 3: DMN10/saline; lane 4: DMN10/MSCs; lane 5: DMN20/MSCs; lane 6: a male Fischer rat 344 as positive control; lane 7: a female Wistar rat as negative control.
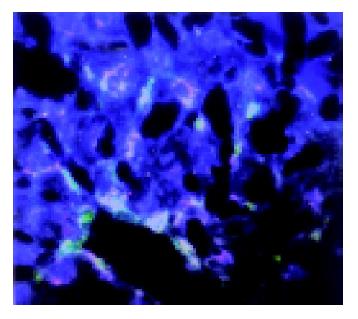
Figure 7 Signals of SRY by FISH with Rat 12/Y whole chromosome probes.
Red color represent chromosome Y, green color represent chromosome 12, blue color represent nuclear. Original magnification ×40.
Figure 8 Morphology of hepatic stellate cells co-culture with or without mesenchymal stem cells by transwell in vitro for 72 h.
A: Hepatic stellate cells co-culture with mesenchymal stem cells; B: hepatic stellate cells co-culture with hepatoceyte cells line; C: hepatic stellate cells only culture. Original magnification ×10.
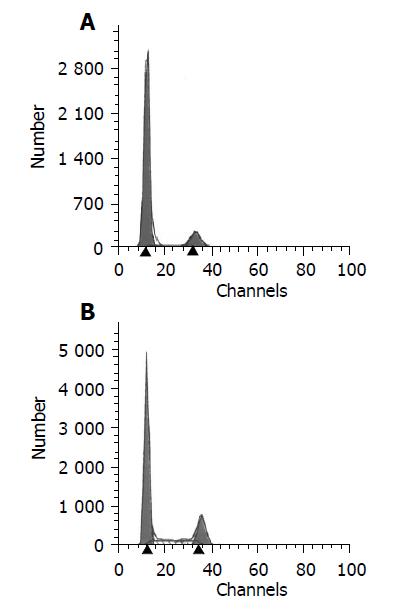
Figure 9 Analysis of hepatic stellate cells by FACS.
A: Hepatic stellate cells co-culture with mesenchymal stem cells; B: hepatic stellate cells only culture.
- Citation: Zhao DC, Lei JX, Chen R, Yu WH, Zhang XM, Li SN, Xiang P. Bone marrow-derived mesenchymal stem cells protect against experimental liver fibrosis in rats. World J Gastroenterol 2005; 11(22): 3431-3440
- URL: https://www.wjgnet.com/1007-9327/full/v11/i22/3431.htm
- DOI: https://dx.doi.org/10.3748/wjg.v11.i22.3431


