©2005 Baishideng Publishing Group Inc.
World J Gastroenterol. Jun 14, 2005; 11(22): 3375-3384
Published online Jun 14, 2005. doi: 10.3748/wjg.v11.i22.3375
Published online Jun 14, 2005. doi: 10.3748/wjg.v11.i22.3375
Figure 1 Evaluation of the purity and response of cultured murine CEC.
A: CEC from 4-6 wk old C57BL/6 mice were cultured for 72 h in medium alone (M) or in medium containing Bacteroides ovatus (Bo), E. coli (Ec) or Lactobacillus rhamnosus (Lr) after which CEC RNA was extracted, reverse transcribed and cDNA amplified by RT-PCR using primers specific for CD45 or vimentin. PCR products were separated by gel electrophoresis and EtBr-stained amplicons visualized and digitally recorded under UV illumination. The sensitivity of CD45 detection was determined by adding spleen cells to highly purified CECs so that they comprised 2% or 10% of the total cell population prior to RNA extraction and RT-PCR analysis. Control samples (Ctrl) were spleen cells (+Ctrl) and no cDNA (-Ctrl) for CD45 RT-PCR and fibroblasts for vimentin RT-PCR assay. The results are representative of more than 10 independent experiments; B: TLR2 and TLR4 expression by CEC. The dashed line on the histogram plots represents staining with control antibody, the bold line represents staining profile of anti-TLR4 and the filled in histogram plot represents anti-TLR2 antibody staining; C: Responsiveness of TLR expressed by CEC. Supernatants from 4 h cultures of CEC in medium alone (Med) or in medium containing LPS (10 μg/mL) or PGN (1 μg/mL) were assayed for the presence of IL-6 and MCP-1 by ELISA. The results shown were collated from three independent experiments. The error bars represent SEM. aP<0.05 LPS vs medium values, bP<0.01 PGN vs medium values, cP<0.002 LPS vs medium values.
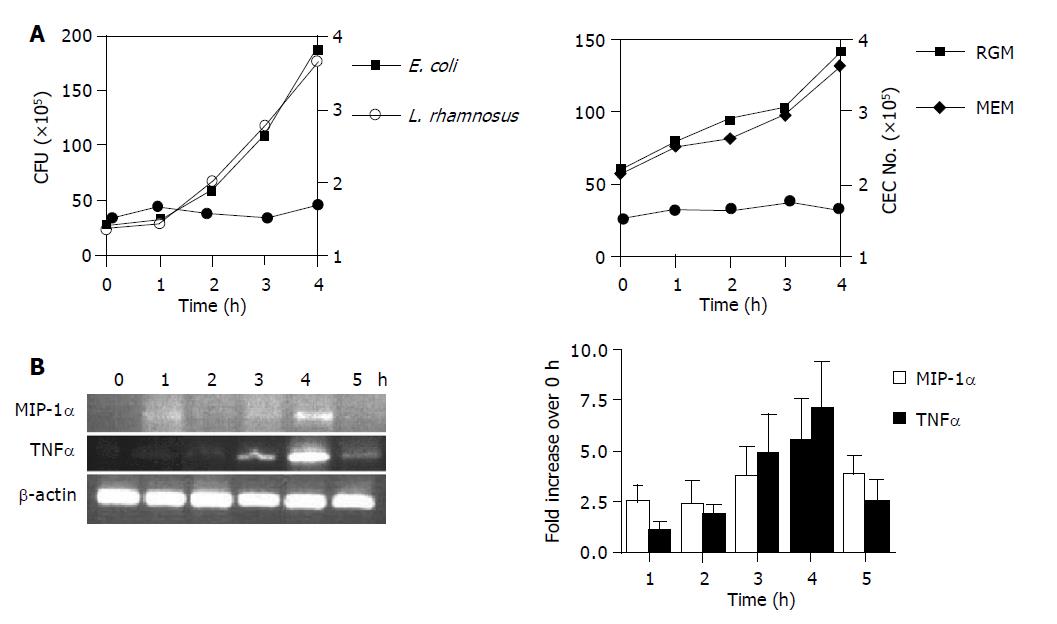
Figure 2 Bacterial growth (A) and kinetics of CEC cytokine gene expression (B) in CEC:bacteria co-cultures.
A: Determination of bacterial (L. rhamnosus and E. coli) CFU by harvesting cells from CEC:bacteria co-cultures at hourly intervals up to 4 h by extensive washing of adherent CEC and plating serial dilutions onto agar plates and counting bacterial colonies 24 h later (left-hand panel). B. ovatus were cultured either alone under anaerobic conditions in RGM media or with CEC in 50 mL/L CO2 and complete MEM (right-hand panel). CEC numbers (solid circle on both graphs) were determined by counting the number of cells recovered from co-cultures at the indicated times using a counting chamber; B: CEC cultured in the presence of E. coli for up to 5 h. CECs were processed for RNA isolation and RT-PCR analysis using primers specific for the housekeeping gene β-actin, and MIP-1α and TNFα as described in Materials and Methods. Quantitative densitometry was carried out on EtBr-stained gels and the results from three independent experiments were compiled to produce the data shown. Error bars indicate 95% confidence limits.
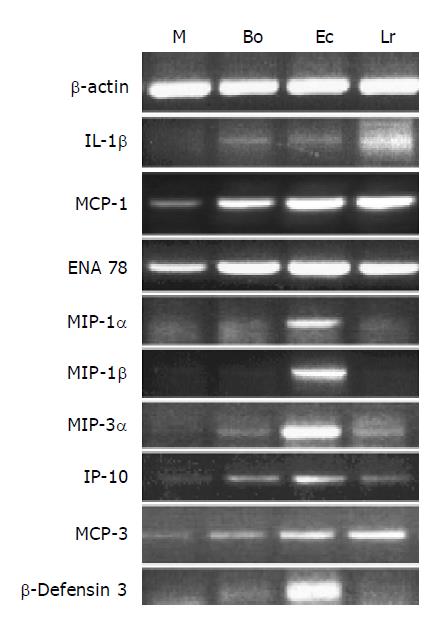
Figure 3 Changes in expression of cytokine genes in CEC in response to commensal bacteria.
CECs were cultured for 4 h in complete medium alone (M) or in medium containing Bacteroides ovatus (Bo), E. coli (Ec) or Lactobacillus rhamnosus (Lr) after which RNA was extracted from CECs and processed for RT-PCR analysis using primers for β-actin and genes encoding cytokines and the anti-microbial peptide, β-defensin3 as described in the Materials and methods section. The results shown are typical of those obtained from a total of six independent experiments.
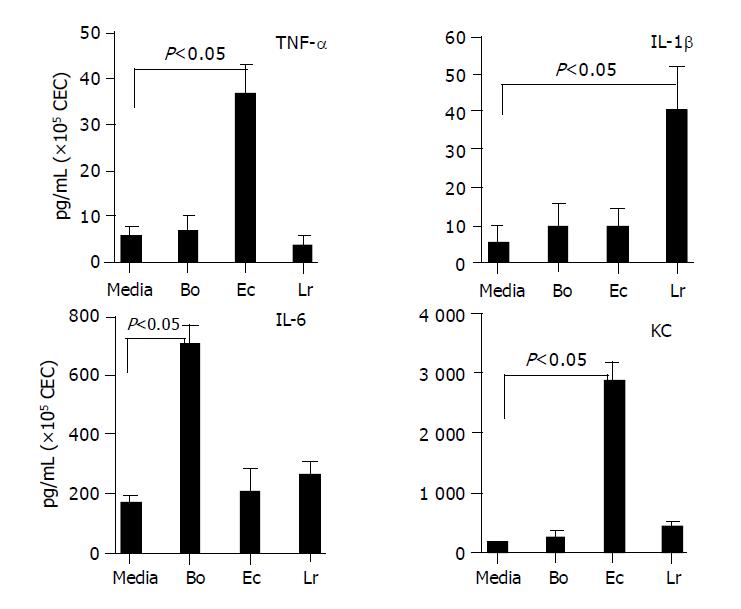
Figure 4 Profile of cytokines secreted by CEC in response to commensal bacteria.
CECs were cultured for 4 h in complete medium alone (M) or in medium containing Bacteroides ovatus (Bo), E. coli (Ec) or Lactobacillus rhamnosus (Lr) after which conditioned medium was assayed for the presence of IL-6, TNF-α, IL-1β and KC. The amount of cytokine present was determined by reference to a standard curve generated using known amounts of recombinant protein. The limit of detection of each assay was ~5 pg/mL. The results shown were obtained by combining the data sets from a minimum of three independent experiments. Error bars designate 95% confidence limits.
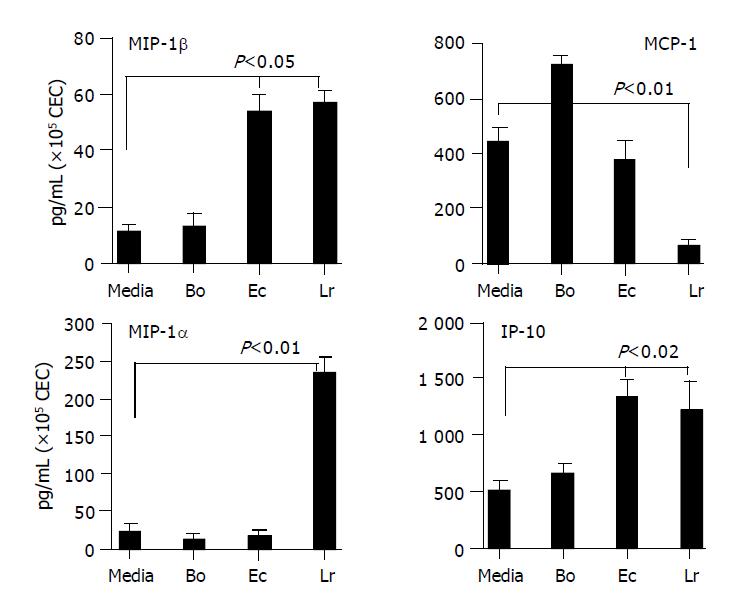
Figure 5 Chemokines secreted by CEC in response to commensal bacteria.
CECs were cultured for 4 h in complete medium alone (M) or in medium containing Bacteroides ovatus (Bo), E. coli (Ec) or Lactobacillus rhamnosus (Lr) after which conditioned medium was assayed for the presence of MIP-1α, MIP-1β, IP-10 and MCP-1. The amount of chemokine present was determined by reference to a standard curve generated using known amounts of recombinant protein. The limit of detection of each assay was ~10 pg/mL. The results shown were obtained by combining the data sets from at least three independent experiments. Error bars designate 95% confidence limits.
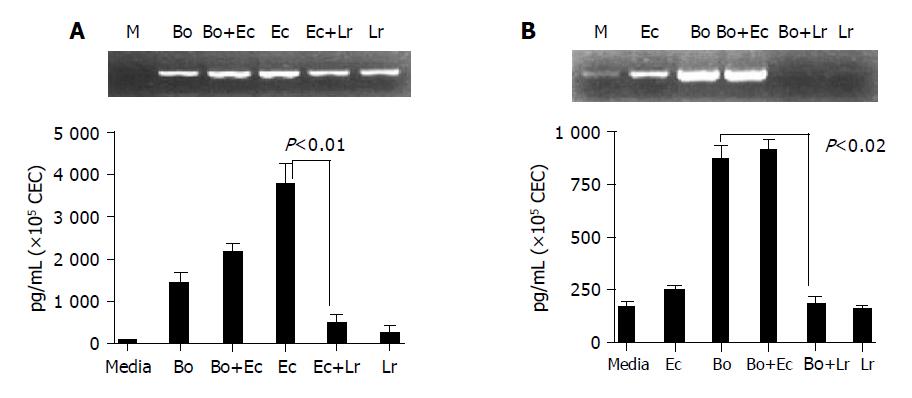
Figure 6 L.
rhamnosus (LGG) interferes with E. coli- and B. ovatus-induced cytokine production by CEC. CEC were cultured for 4 h with individual bacteria alone or with a mixture of equal numbers of two different bacteria (B. ovatus+ E. coli or E. coli+L. rhamnosus) such that the total number of bacteria in each culture was the same. A: KC mRNA and protein expression by RT-PCE and ELISA; B: IL-6 mRNA and protein expression by RT-PCR and ELISA. ELISA data was obtained by combining the data sets from three independent experiments. Error bars designate 95% confidence limits.
- Citation: Lan JG, Cruickshank SM, Singh JCI, Farrar M, Lodge JPA, Felsburg PJ, Carding SR. Different cytokine response of primary colonic epithelial cells to commensal bacteria. World J Gastroenterol 2005; 11(22): 3375-3384
- URL: https://www.wjgnet.com/1007-9327/full/v11/i22/3375.htm
- DOI: https://dx.doi.org/10.3748/wjg.v11.i22.3375


