©2005 Baishideng Publishing Group Co.
World J Gastroenterol. Jan 14, 2005; 11(2): 221-227
Published online Jan 14, 2005. doi: 10.3748/wjg.v11.i2.221
Published online Jan 14, 2005. doi: 10.3748/wjg.v11.i2.221
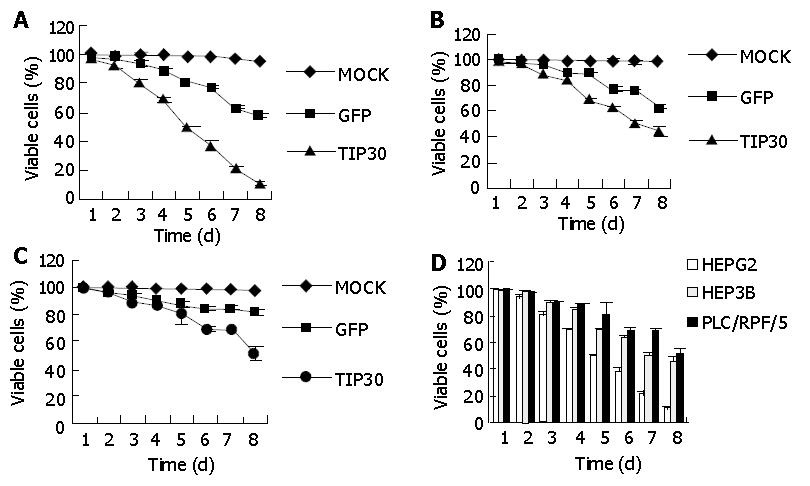
Figure 1 Cell viability of hepatoblastoma cell lines: HepG2, Hep3B and PLC/RPF/5 on indicated days as measured by XTT assay following infection with Ad-TIP30 and GFP at MOI of 20 or treatment of PBS (mock) (A, B, C).
Three cell lines were infected with TIP30 at MOI of 20 in 8 continuous days (D). Values in the figures are mean±SD.
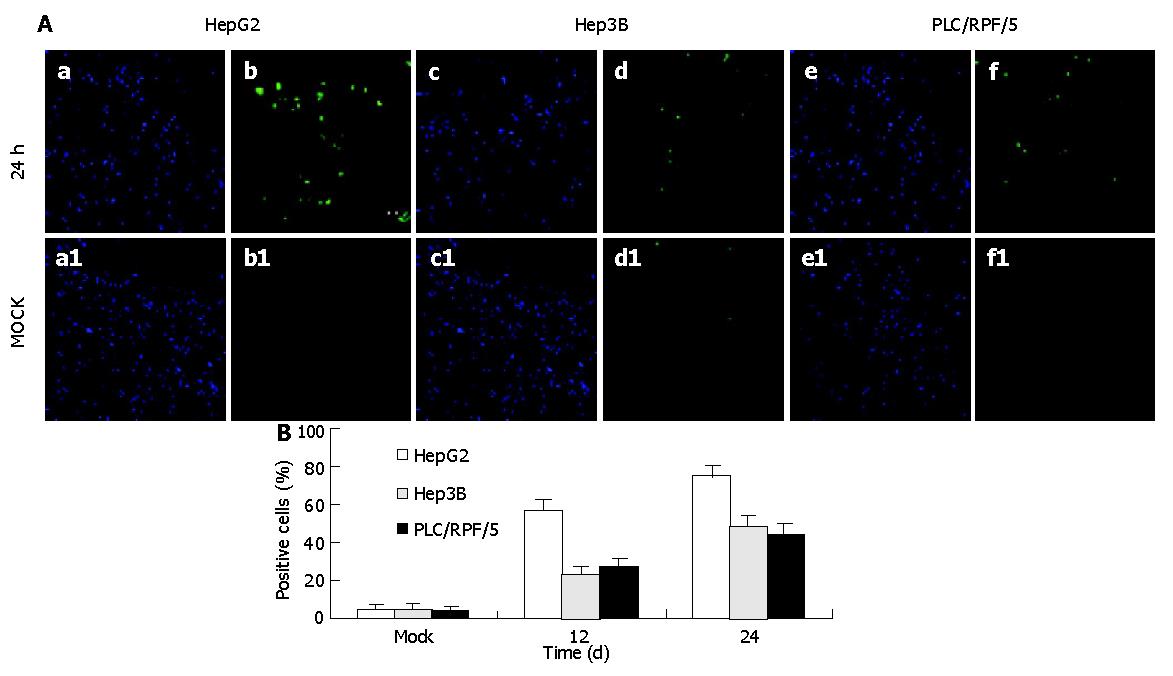
Figure 2 TUNEL (in situ) assay for TIP30 infection induced apoptosis at 24 h after infection and description of cell population with DAPI (a, c, d) and fluorescent (b, d, f) microscopy with mock as control.
A: The mean of percentages of positive cells was calculated from the analysis; B: Data in the figure are mean±SD (P<0.01).
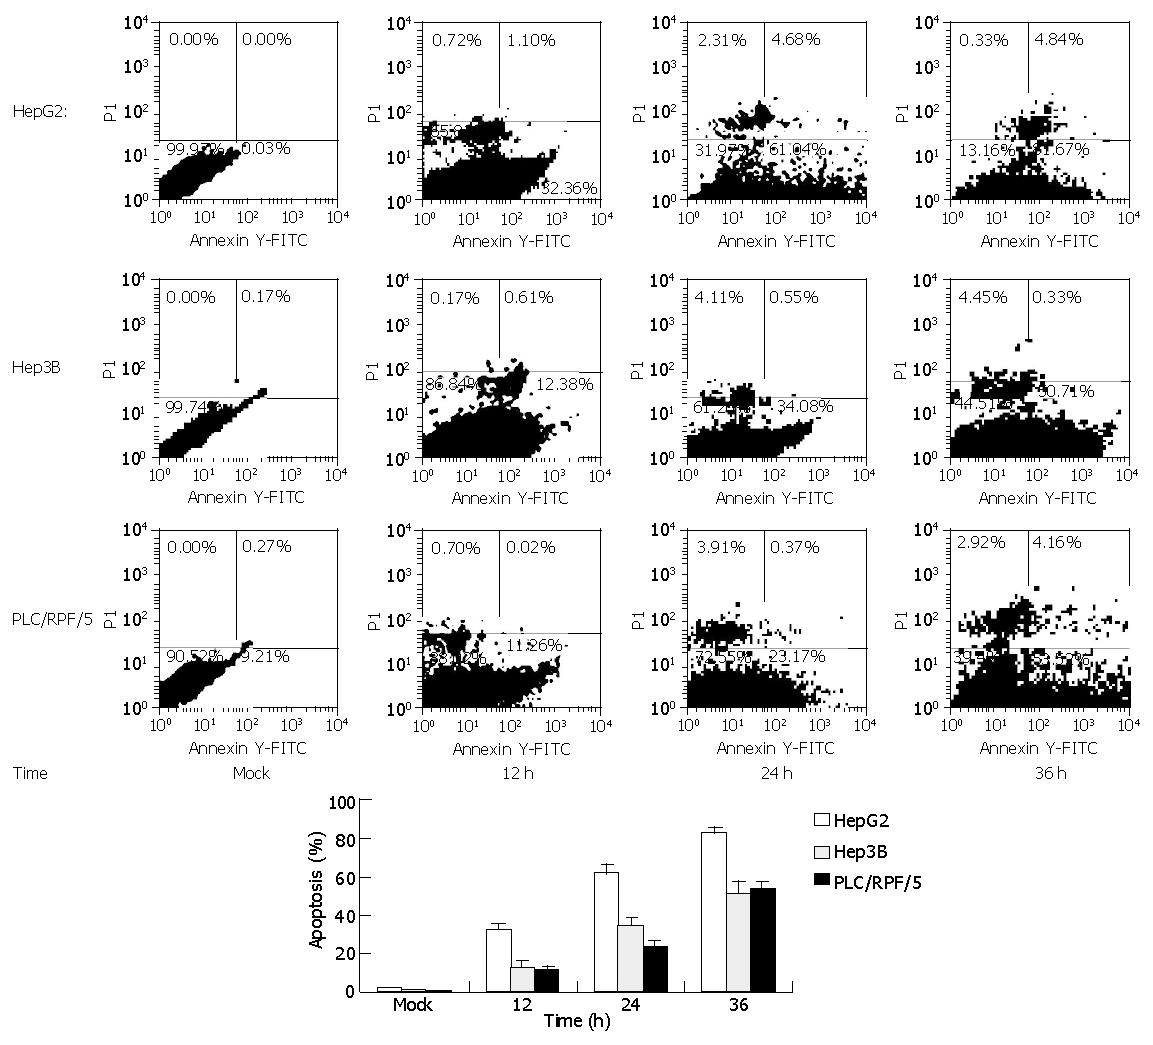
Figure 3 FACS analyses of annexin-V-FITC and PI double-stained cells.
Cells were infected with Ad-TIP30 and mock as control (no virus). After treatment for 12, 24, 36 h, cells were double-stained at various indicated time points with annexin-V-FITC and PI and analyzed by flow cytometry. Cells appearing in the lower right quadrant showed positive annexin-V-FITC staining, which indicated phosphatidylserine translocation to the cell surface and no DNA staining by PI. Data in the figures are mean±SD. The percentage of apoptosis cells of three cell lines treated as previously (P<0.01).
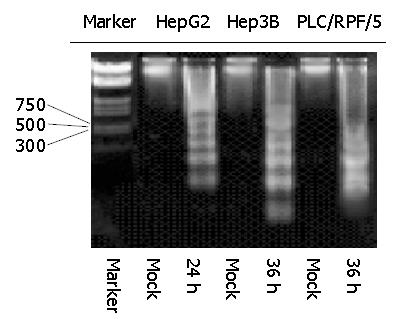
Figure 4 Kinetics of apoptosis in HepG2 and Hep3B and PLC/RPF/5 cells infected with Ad-TIP30.
Twelve, twenty-four or thirty-six hours after infection, analysis of DNA laddering was performed by gel electrophoresis. An overexposed photograph was provided to show the beginning of DNA laddering at 24 h in HepG2 cells and at 36 h in Hep3B and PLC/RPF/5 cells.
Figure 5 Western blotting analysis of p53 protein in HepG2 cells infected with Ad-TIP30.
HepG2 cells were infected with Ad-TIP30. Harvested protein (50 ug/lane) was applied to 12% SDS-polyacrylamide electrophoresis. Proteins were transferred to PVDF film and probed with anti-serum specific for p53. p53 levels were quantified by densitometric analysis and normalized to β-actin. The data shown here were representative of three independent experiments with a similar result.
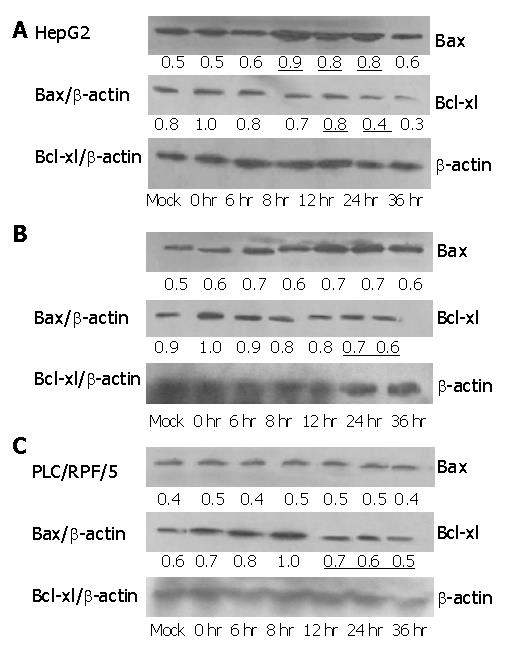
Figure 6 Expression of Bax and Bcl-xl after infection with Ad-TIP30 and mock as control in the three cell lines.
Lysates were collected at 0, 6, 8, 12, 24, 36 h after infection. Ad-TIP30 infection resulted in increased Bax protein expression which was at its peak at 12-24 h after infection in HepG2 cells (Figure 6A), and decreased Bcl-xl protein levels in three cell lines (Figures 6A-C).
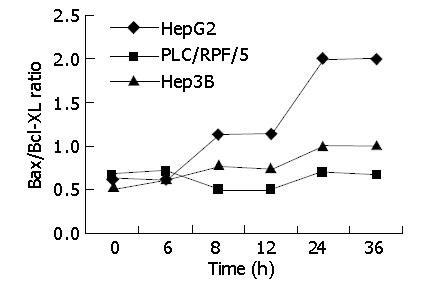
Figure 7 Infection of Ad-TIP30 with immunoblot analysis: densitometric analysis of the bands.
The cells were infected with Ad-TIP30 and mock (no virus) as control in HepG2, Hep3B and PLC/RF/5 cells. The variation of Bax/Bcl-xl ratio in the three cell lines with time course was shown.
- Citation: Shi M, Zhang X, Wang P, Zhang HW, Zhang BH, Wu MC. TIP30 regulates apoptosis-related genes in its apoptotic signal transduction pathway. World J Gastroenterol 2005; 11(2): 221-227
- URL: https://www.wjgnet.com/1007-9327/full/v11/i2/221.htm
- DOI: https://dx.doi.org/10.3748/wjg.v11.i2.221


