©2005 Baishideng Publishing Group Inc.
World J Gastroenterol. May 14, 2005; 11(18): 2748-2753
Published online May 14, 2005. doi: 10.3748/wjg.v11.i18.2748
Published online May 14, 2005. doi: 10.3748/wjg.v11.i18.2748
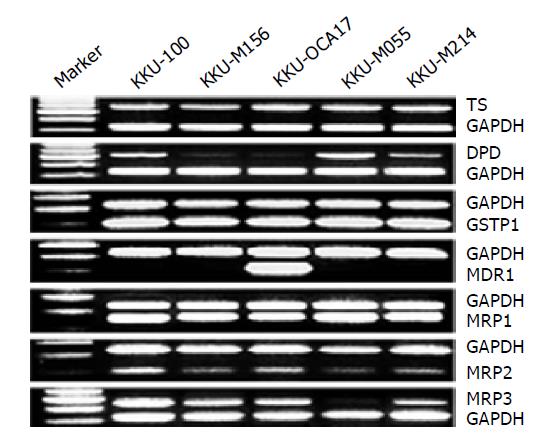
Figure 1 Expressions of TS, DPD, GSTP1, MDR1 and MRPs mRNA in five CCA cell lines determined by semi-quantitative RT-PCR analysis.
Total RNA was extracted and used for RT-PCR. Each lane was loaded with 25 μL of PCR product. mRNA of the gene of interest was co-amplified with GAPDH mRNA as an internal control. Lane 1 is 100 bp DNA marker, lane 2-6 are PCR products from KKU-100, KKU-M156, KKU-OCA17, KKU-M055 and KKU-M214, respectively.
Figure 2 Relationships between the relative mRNA expression of MRP3 and the IC50 value of etoposide.
(A) doxorubicin; (B) and pirarubicin; (C) in five CCA cell lines.
- Citation: Tepsiri N, Chaturat L, Sripa B, Namwat W, Wongkham S, Bhudhisawasdi V, Tassaneeyakul W. Drug sensitivity and drug resistance profiles of human intrahepatic cholangiocarcinoma cell lines. World J Gastroenterol 2005; 11(18): 2748-2753
- URL: https://www.wjgnet.com/1007-9327/full/v11/i18/2748.htm
- DOI: https://dx.doi.org/10.3748/wjg.v11.i18.2748


