©2005 Baishideng Publishing Group Inc.
World J Gastroenterol. May 7, 2005; 11(17): 2539-2544
Published online May 7, 2005. doi: 10.3748/wjg.v11.i17.2539
Published online May 7, 2005. doi: 10.3748/wjg.v11.i17.2539
Figure 1 iNOS staining.
A: iNOS staining detected in cytoplasms of tumor cells (thick arrow) and in inflammatory cells (thin arrows); B: Negative control; C: No positive immunohistostaining for iNOS in normal gastric tissue sections. Magnification A and B ×1000; C ×400.
Figure 2 NT staining.
A: NT staining detected in cytoplasms and nuclei of tumor cells (arrow); B: Negative control; C: No positive immunoreactivity in normal gastric tissue sections. Magnification ×400.
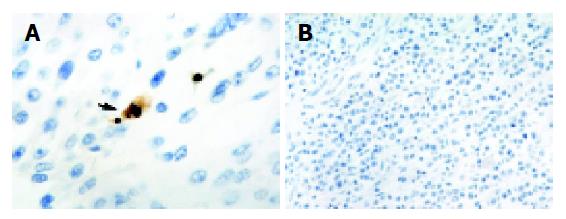
Figure 3 Apoptotic cells and bodies staining.
A: An apoptotic body characterized by a pyknotic nucleus surrounded by shrunken cytoplasm and separated from the surrounding cells by a halo (arrow); B: Negative control. Magnification A ×1000; B ×400.
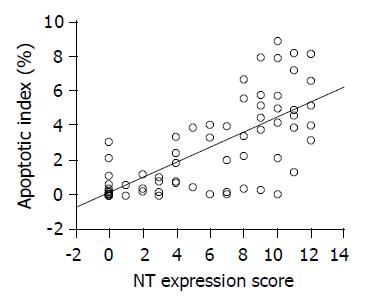
Figure 4 Significantly direct correlation between AI and NT expression observed by using the Spearman rank correlation coefficient (r = 0.
718; P<0.001).
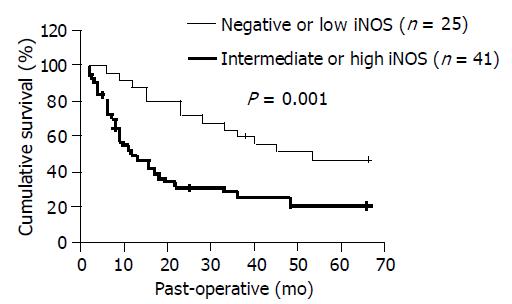
Figure 5 Survival of patients relative to iNOS status.
Solid line: negative or low iNOS expression; dotted line: intermediate or high iNOS expression.
- Citation: Li LG, Xu HM. Inducible nitric oxide synthase, nitrotyrosine and apoptosis in gastric adenocarcinomas and their correlation with a poor survival. World J Gastroenterol 2005; 11(17): 2539-2544
- URL: https://www.wjgnet.com/1007-9327/full/v11/i17/2539.htm
- DOI: https://dx.doi.org/10.3748/wjg.v11.i17.2539


