Copyright
©2005 Baishideng Publishing Group Inc.
World J Gastroenterol. Apr 28, 2005; 11(16): 2508-2512
Published online Apr 28, 2005. doi: 10.3748/wjg.v11.i16.2508
Published online Apr 28, 2005. doi: 10.3748/wjg.v11.i16.2508
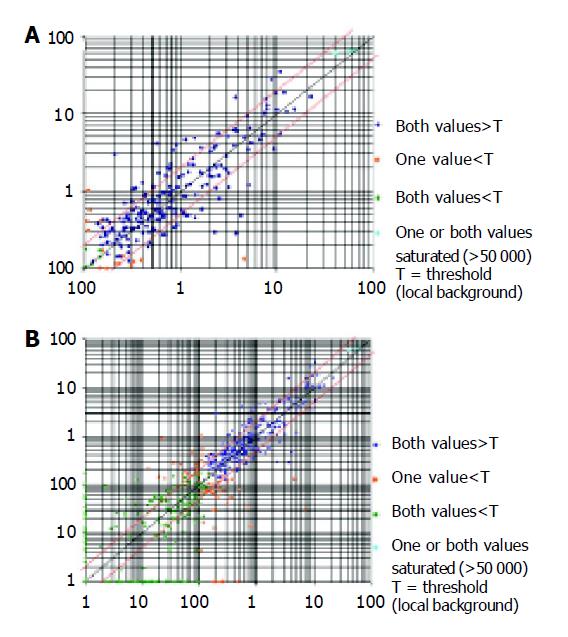
Figure 1 Chip result analysis of EC cells (A) and U937 cell line (B).
The x-axis is the relative intensity of cy3 signal, and y-axis is the relative intensity of cy5 signal. The ratio x/y≥R2 shows that the gene expression was up-regulated, and x/y≤0.5 shows that the gene was down-regulated.
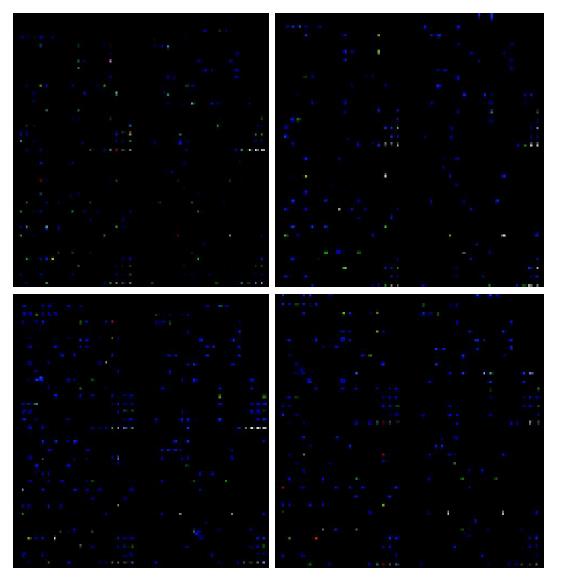
Figure 2 U937 mRNA expression analysis using Mergen cDNA arrays.
These maps revealed a number of genes that were significantly expressed in controls and MCP-1 treated cells, with an expression ratio above 2 (the red color dot, more red color dots indicate more highly expressed genes) or below 0.5 (the blue color dot, more blue color dots indicate meagerly expressed genes). Results were the mean from two separate experiments and were arranged in order of decreasing relative expression after treated with MCP-1 compared with untreated controls. A correlation analysis of the results from the two separate experiments showed that the findings were highly reproducible, because r = 0.897 for the 25 genes with the highest relative mRNA expression after MCP-1 treatment.
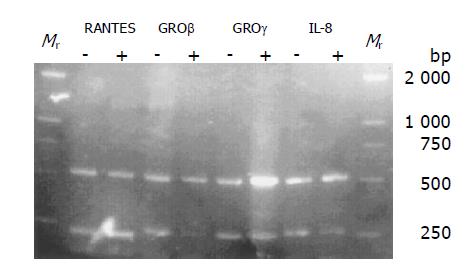
Figure 3 Primers and amplification of RT-PCR analysis.
The full names of the genes and their accession numbers are given in bold in Tables 1 and 2. Sense and anti-sense primers were used to detect mRNA expression of the indicated genes by RT-PCR. The last two columns give the quantity of total RNA added to each RT-PCR reaction and the number of PCR cycles for PCR amplification used for RT-PCR analysis in MCP-1 treated U937 cells (+, MCP-1 treated). The same RT-PCR conditions were used for U937 cells (-, controls). β-actin was used as a quantitative control (sense: 5’-GGCATCCTCACCCTGAAGTA-3’; antisense: 5’-CCATCTCTTGCTCGAAGTCC-3’; 60 °C; 496 bp; 1 μg; 30 cycles), RANTES (sense: 5’-CCCTCACCATCATCCTCACT-3’; antisense: 5’-TCCTT-CGAGTGACAAACACG-3’; 50 °C; 186 bp; 1 μg; 30 cycles), GROβ (sense: 5’-ATTCGGGGCAGAAAGAGAAC-3’; antisense: 5’-ACCCCTTTTATGCATGGTTG-3’; 60 °C; 207 bp; 1 μg; 35 cycles), GROγ (sense: 5’-GAATTTGGGGCAGAA-AATGA-3’; antisense: 5’-CGAACCCTTTTTATGCATGG-3’; 60 °C; 227 bp; 1 μg; 30 cycles) and IL-8 (sense: 5’-AAGGAACCATCTCACTGTGTGTAAAC-3’; antisense: 5’;-TTAGCACTCCTTGGCAAACTG-3’; 60 °C; 247 bp; 1 μg; 25 cycles).
- Citation: Bian GX, Miao H, Qiu L, Cao DM, Guo BY. Profiling of differentially expressed chemotactic-related genes in MCP-1 treated macrophage cell line using human cDNA arrays. World J Gastroenterol 2005; 11(16): 2508-2512
- URL: https://www.wjgnet.com/1007-9327/full/v11/i16/2508.htm
- DOI: https://dx.doi.org/10.3748/wjg.v11.i16.2508


