Copyright
©2005 Baishideng Publishing Group Inc.
World J Gastroenterol. Apr 21, 2005; 11(15): 2340-2345
Published online Apr 21, 2005. doi: 10.3748/wjg.v11.i15.2340
Published online Apr 21, 2005. doi: 10.3748/wjg.v11.i15.2340
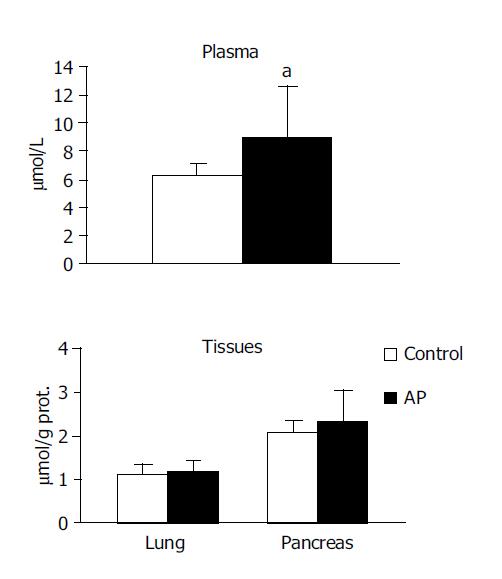
Figure 1 Extent of lipooxidative damage assessed as TBARS in plasma, lung and pancreas in experimental groups.
aP<0.05 vs control. AP: acute pancreatitis.
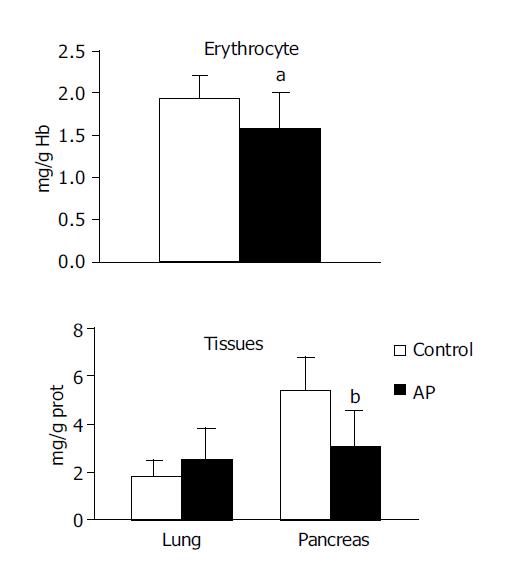
Figure 2 GSH levels in plasma, lung and pancreas in experimental groups.
aP<0.05 vs control, bP<0.001 vs control. AP: acute pancreatitis.
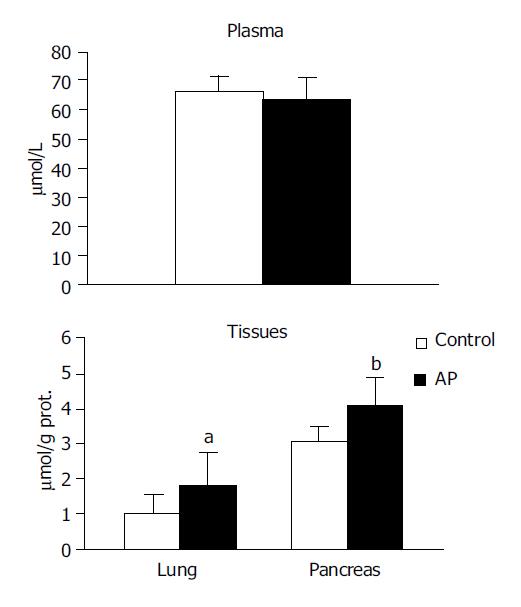
Figure 3 NOx levels in plasma, lung and pancreas in experimental groups.
NOx: nitrite plus nitrate, AP: acute pancreatitis. aP<0.05 vs control, bP<0.01 vs control.
- Citation: Andican G, Gelisgen R, Unal E, Tortum OB, Dervisoglu S, Karahasanoglu T, Burçak G. Oxidative stress and nitric oxide in rats with alcohol-induced acute pancreatitis. World J Gastroenterol 2005; 11(15): 2340-2345
- URL: https://www.wjgnet.com/1007-9327/full/v11/i15/2340.htm
- DOI: https://dx.doi.org/10.3748/wjg.v11.i15.2340


