Copyright
©2005 Baishideng Publishing Group Inc.
World J Gastroenterol. Jan 7, 2005; 11(1): 36-40
Published online Jan 7, 2005. doi: 10.3748/wjg.v11.i1.36
Published online Jan 7, 2005. doi: 10.3748/wjg.v11.i1.36
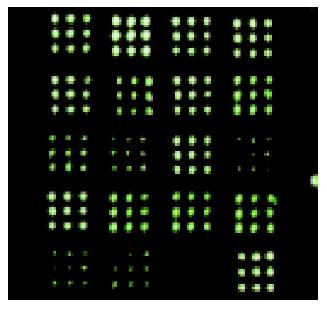
Figure 1 Scanning picture of hybridization.
In the microarray, the signals of housekeeping genes were positive and those of HCV genes were negative. The 15 probes of mtRNA showed different hybridizing signals in the same gastric tissues, and some probes showed different hybridizing signals in cancerous tissue and normal gastric mucosal tissue.
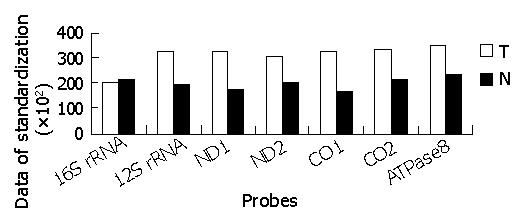
Figure 2 Quantitative analysis of mtRNA in different gastric tissues.
After standardization of the two groups of data with housekeeping genes, the quantity of mtRNA in different gastric tissues using microarray was different. Moreover, the expression in different genes of mtDNA was different. T: gastric cancerous tissue; N: normal gastric mucosal tissue adjacent to cancer.
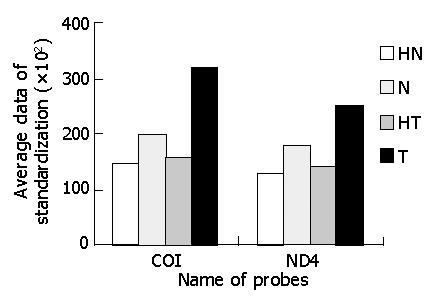
Figure 3 Reliability of mtRNA expression microarray method.
HN: hybridization of housekeeping gene β-action in normal gastric mucous tissue. N: hybridization of ND4 or CO I in normal gastric mucosal tissue. HT: hybridization of housekeeping gene β-action in cancerous tissue; T: hybridization of ND4 or CO I in cancerous tissue.
Figure 4 Data after standardization.
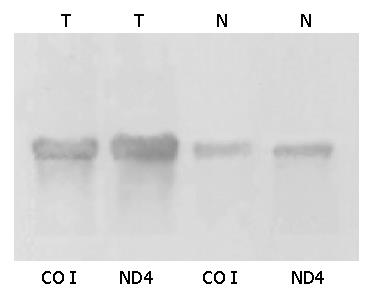
Figure 5 Northern blot of mtRNA extracted from gastric carcinoma and normal gastric mucosal tissues adjacent to the carcinoma.
T: gastric cancerous tissue; N: normal gastric mucosal tissue.
- Citation: Han CB, Mao XY, Xin Y, Wang SC, Ma JM, Zhao YJ. Quantitative analysis of tumor mitochondrial RNA using microarray. World J Gastroenterol 2005; 11(1): 36-40
- URL: https://www.wjgnet.com/1007-9327/full/v11/i1/36.htm
- DOI: https://dx.doi.org/10.3748/wjg.v11.i1.36


