Copyright
©The Author(s) 2004.
World J Gastroenterol. Dec 15, 2004; 10(24): 3691-3695
Published online Dec 15, 2004. doi: 10.3748/wjg.v10.i24.3691
Published online Dec 15, 2004. doi: 10.3748/wjg.v10.i24.3691
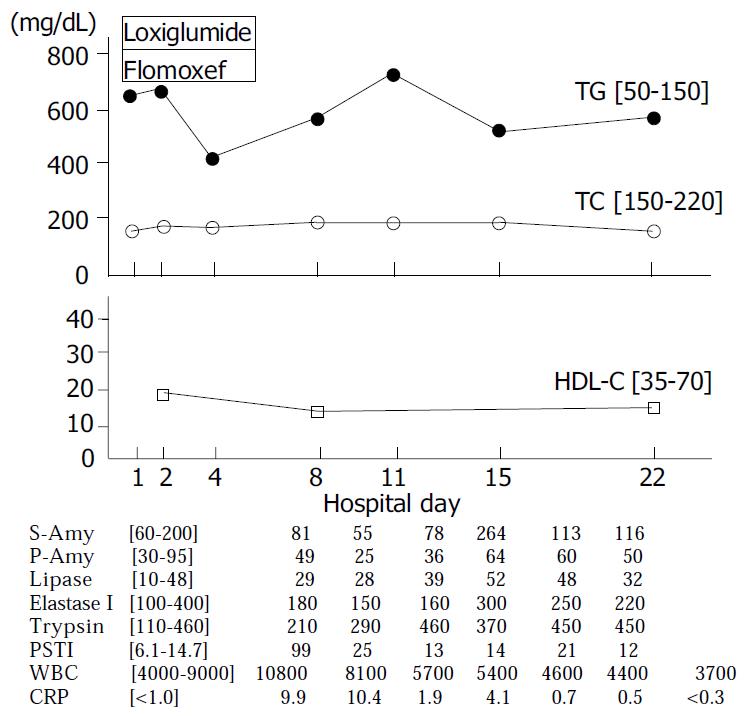
Figure 1 Clinical course of case 1.
Normal range is shown in [ ]. TG: triglycerides, TC: total cholesterol, HDL-C: high den-sity lipoprotein-cholesterol, S-Amy: salivary amylase, P-Amy: pancreatic amylase, PSTI: pancreatic secretory trypsin inhibitor, WBC: white blood cell, CRP: C-reactive protein.
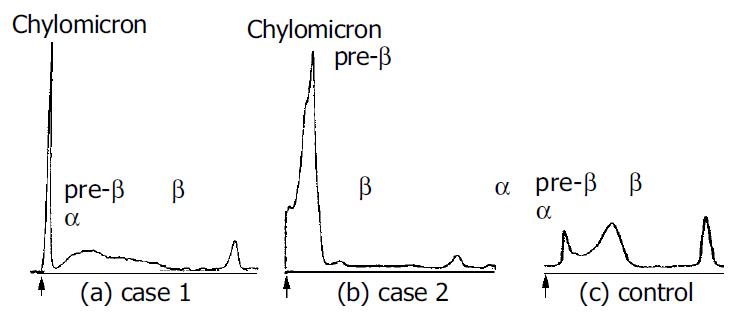
Figure 2 Polyacrylamide gel electrophoresis using the fasting plasma of (a) case 1, (b) case 2 and (c) control.
The presence of chylomicrons is demonstrated at the base line indicated by arrows (↑).
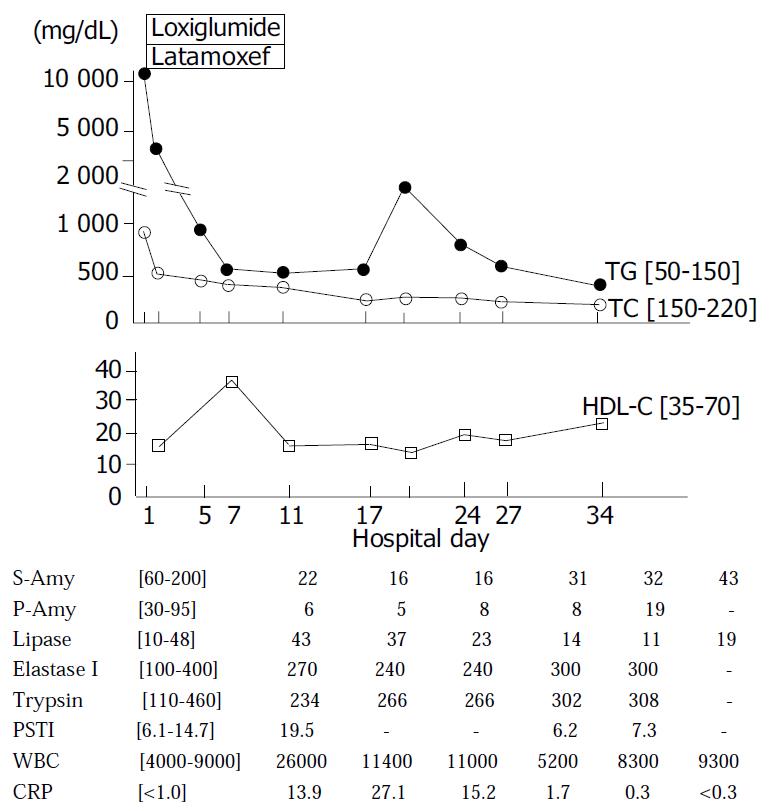
Figure 3 Clinical course of case 2.
Normal range is shown in [ ]. TG: triglycerides, TC: total cholesterol, HDL-C: high den-sity lipoprotein-cholesterol, S-Amy: salivary amylase, P-Amy: pancreatic amylase, PSTI: pancreatic secretory trypsin inhibitor, WBC: white blood cell, CRP: C-reactive protein.
- Citation: Okura Y, Hayashi K, Shingu T, Kajiyama G, Nakashima Y, Saku K. Diagnostic evaluation of acute pancreatitis in two patients with hypertriglyceridemia. World J Gastroenterol 2004; 10(24): 3691-3695
- URL: https://www.wjgnet.com/1007-9327/full/v10/i24/3691.htm
- DOI: https://dx.doi.org/10.3748/wjg.v10.i24.3691


