Copyright
©The Author(s) 2004.
World J Gastroenterol. Dec 15, 2004; 10(24): 3602-3607
Published online Dec 15, 2004. doi: 10.3748/wjg.v10.i24.3602
Published online Dec 15, 2004. doi: 10.3748/wjg.v10.i24.3602
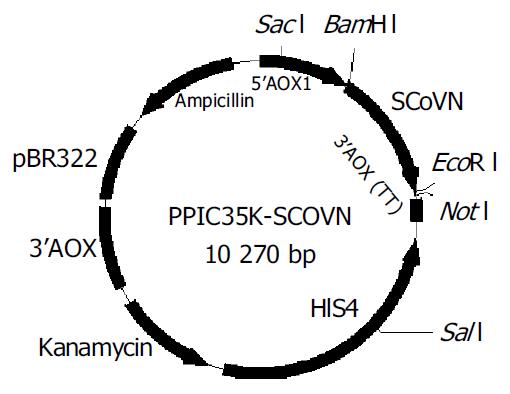
Figure 1 Construct of expression plasmid pPIC3.
5K-SCoVN under the control of AOX1 promoter (5’ AOX1: promoter fragment; 3’ AOX1 (TT): transcription termination, HIS4 ORF: a select marker, SCoVN was inserted between 5’ AOX1 and 3’ AOX1 (TT), Kanamycin: multi-copy select marker).
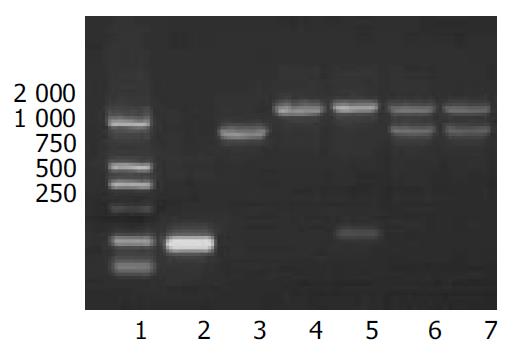
Figure 2 Integration of SCoVN gene into the P.
pastoris GS115 confirmed by PCR using 5’AOX1 primer and 3’AOX1 primer (lane 1: DNA ladder, lane 2: PCR product of pPIC3.5K, lane 3: PCR product of pPIC3.5K-ScoVN, lane 4: PCR product of P.pastoris GS115 without transformation, lane 5: PCR product of control strains, lanes 6 and 7: PCR product of positive recombinants).
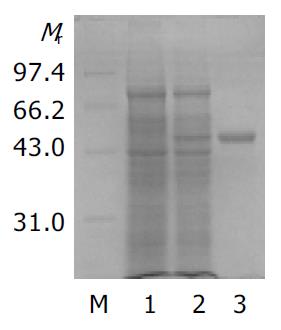
Figure 3 Expression analysis of intracellular SCoVN protein from recombinant yeasts on SDS-PAGE: lane M: protein mo-lecular mass marker; lane 1: protein from control strain; lane 2: proteins from the best strain; lane 3: purified rSCoVN protein; Lane 4: purified ScoVN protein.
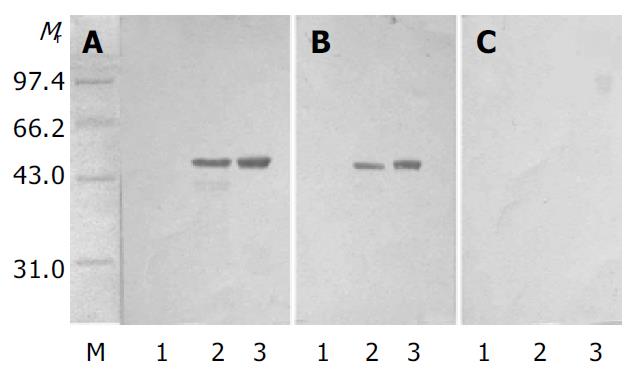
Figure 4 Western blot analysis of intracellular SCoVN pro-tein from recombinant yeasts.
A: Western blot analysis against mouse-anti-SCoVN-mAb; B: Western blot analysis against SARS positive serum; C: Western blot analysis against SARS negative serum: lane M: protein molecular-mass marker; lane 1: protein from control strain; lane 2: proteins from the best strain; lane 3: purified rSCoVN protein.
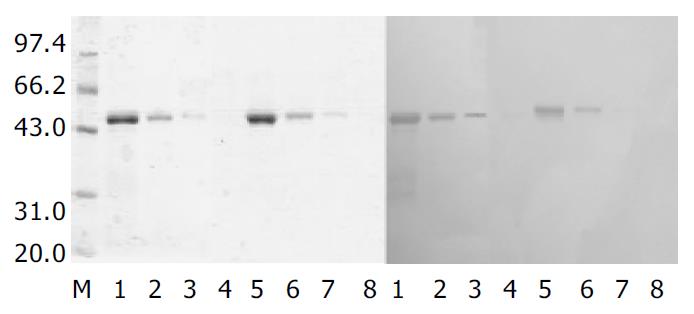
Figure 5 Determination of biological activity of rSCoVN protein expressed in P.
pastoris and E.coli. SDS-PAGE (left) and Western blot (right). Lanes 1, 5: sample containing 12 µg rSCoVN, lanes 2, 6: sample containing 3 µg rSCoVN, lanes 3, 7: sample containing 0.75 µg rSCoVN, lanes 4, 8: sample containing 0.18 µg rSCoVN. Lanes 1, 2, 3, 4: sample expressed in P.pastoris and lanes 5, 6, 7, 8: sample expressed in E.coli.
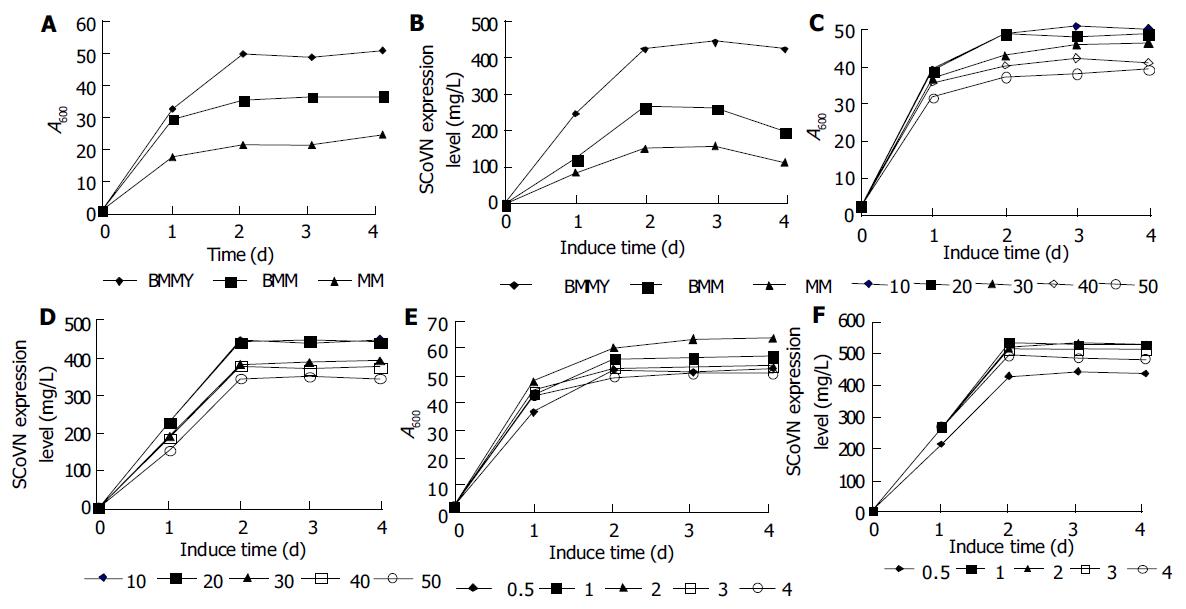
Figure 6 Effects of different media, DO (dissolved oxygen) and methanol amount on the growth and expression of rSCoVN.
A, C, E: Growth curves during induction phase by different media, DO and methanol amount, B, D, F: rSCoVN expression and induction time by different media, DO and methanol amount.
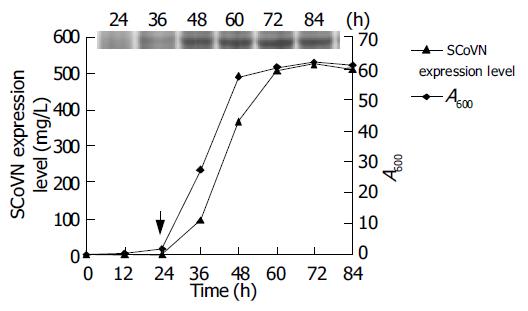
Figure 7 Kinetics of biomass and rSCoVN protein expression using SDS-PAGE over a span of 84 h.
The insert shows rSCoVN protein expression level using SDS-PAGE during the course of experiment.
-
Citation: Liu RS, Yang KY, Lin J, Lin YW, Zhang ZH, Zhang J, Xia NS. High-yield expression of recombinant SARS coronavirus nucleocapsid protein in methylotrophic yeast
Pichia pastoris . World J Gastroenterol 2004; 10(24): 3602-3607 - URL: https://www.wjgnet.com/1007-9327/full/v10/i24/3602.htm
- DOI: https://dx.doi.org/10.3748/wjg.v10.i24.3602


