Copyright
©The Author(s) 2004.
World J Gastroenterol. Dec 15, 2004; 10(24): 3553-3558
Published online Dec 15, 2004. doi: 10.3748/wjg.v10.i24.3553
Published online Dec 15, 2004. doi: 10.3748/wjg.v10.i24.3553
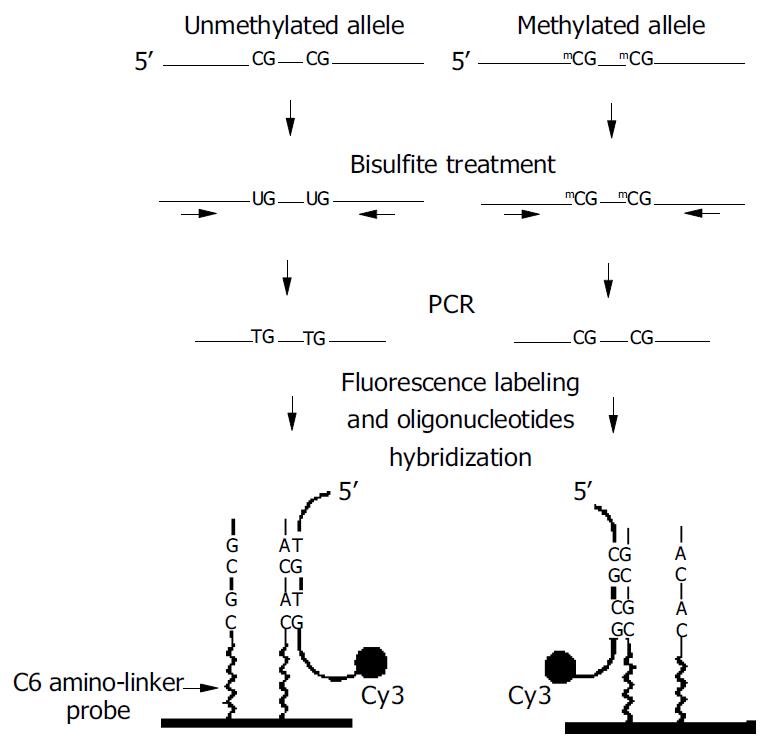
Figure 1 Schematic outline for analysis of DNA methylation based on oligonucleotide microarray[20].
Genomic DNA was bisulfite treated and amplified by PCR for a specific CpG island region of interest. The amplified product was labeled with Cy3 fluorescence dye and hybridized to oligonucleotide probes at-tached to a glass surface. At left an oligonucleotide probe was designed to form a perfect match with a target DNA containing the unmethylated allele. At right a probe was designed to form a perfect match with the methylated DNA target.
Figure 2 Nucleotide sequences of the 5’ untranslated region and the first exon of the p16 gene (Genbank accession no.
U12818.1 GI: 533724). The 23 CpG sites tested by oligonucleotide microarray are underlined and shown in bold.
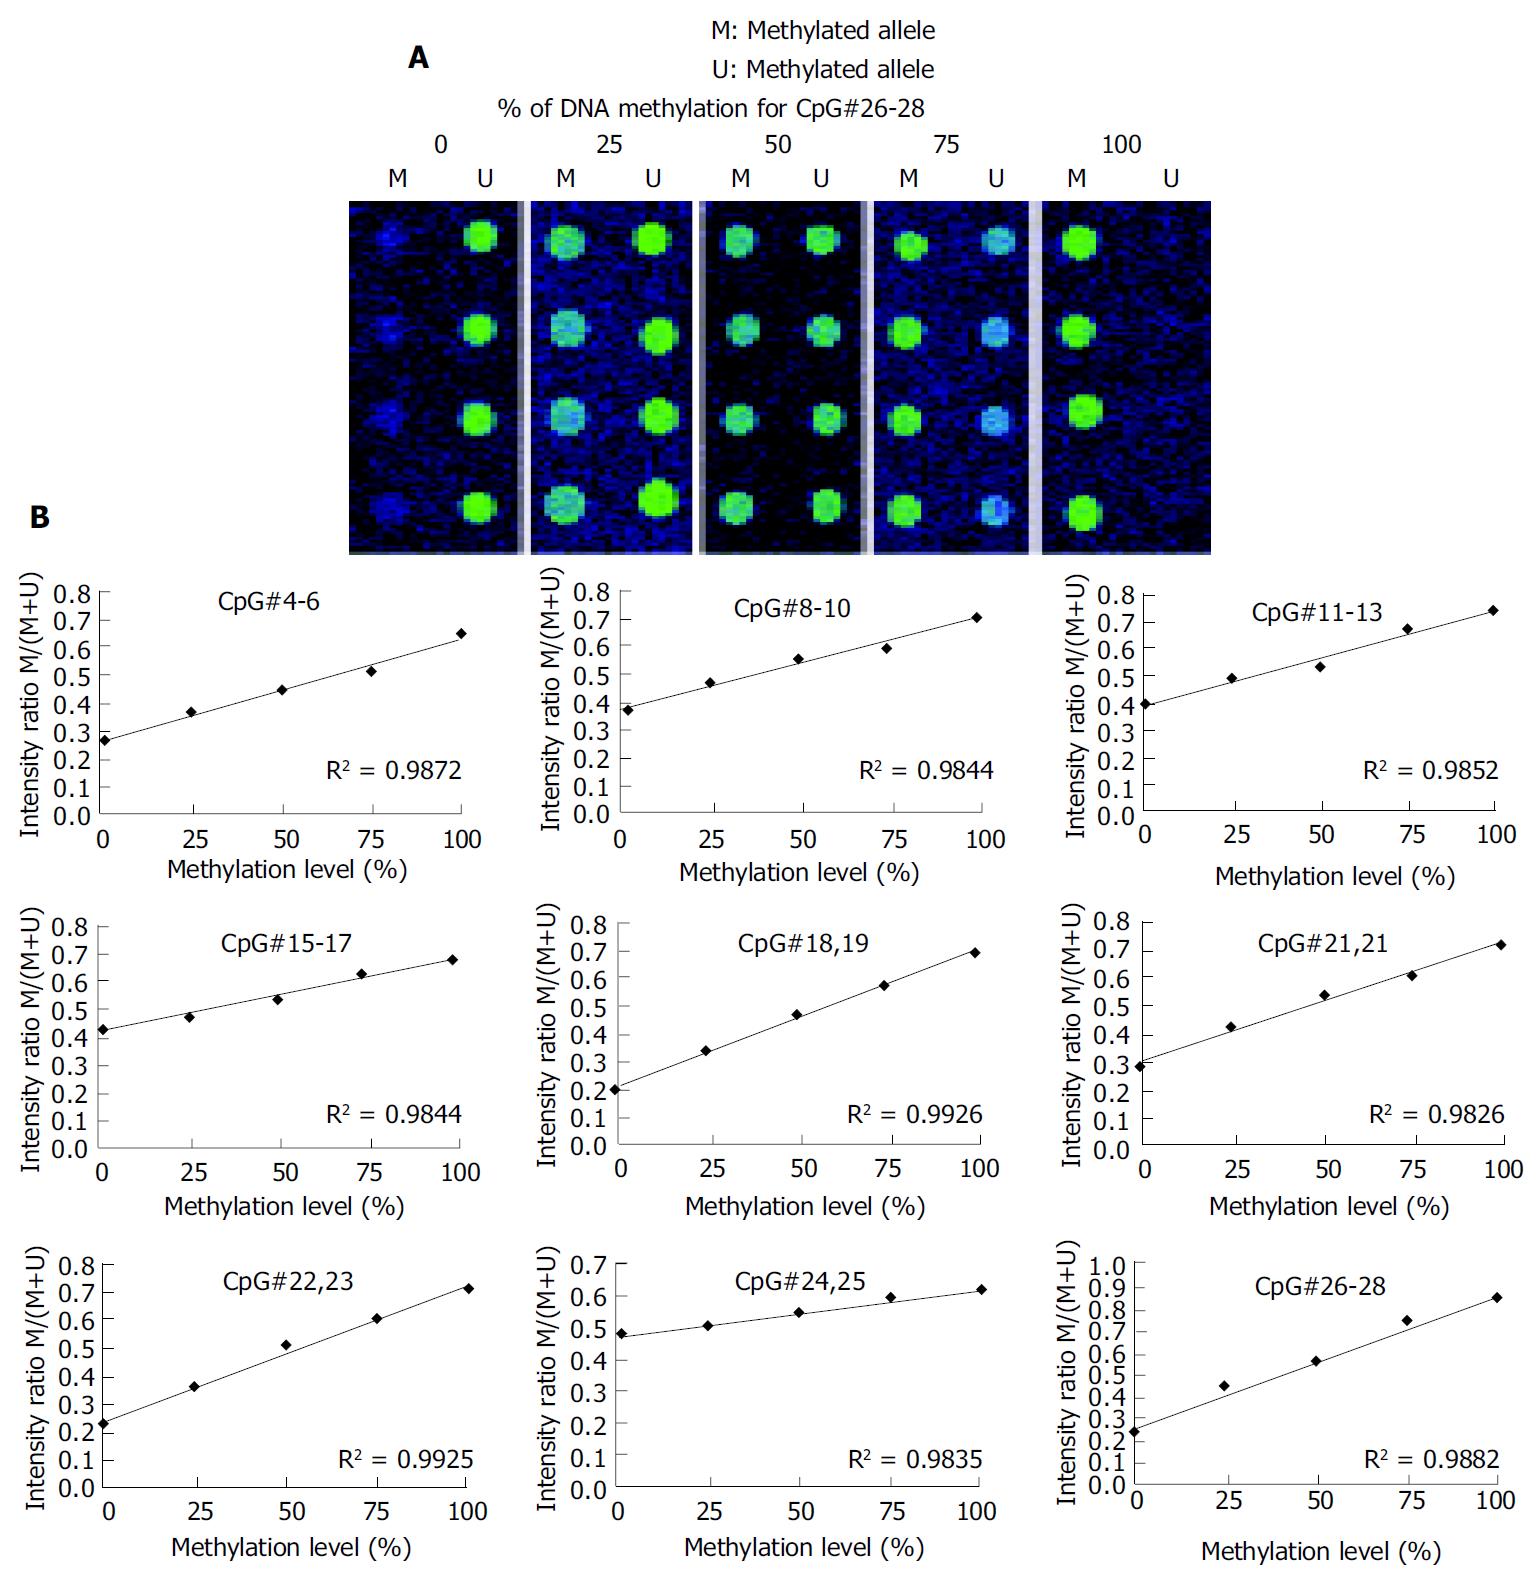
Figure 3 Standardization curve for microarray assays.
A: Mixtures of fully methylated and unmethylated control DNA (from 36 positive recombinant clones) prepared and amplified by PCR using bisulfite primers for the p16 gene CpG island. B: A calibra-tion curve for measuring methylation changes at the p16 gene CpG sites.
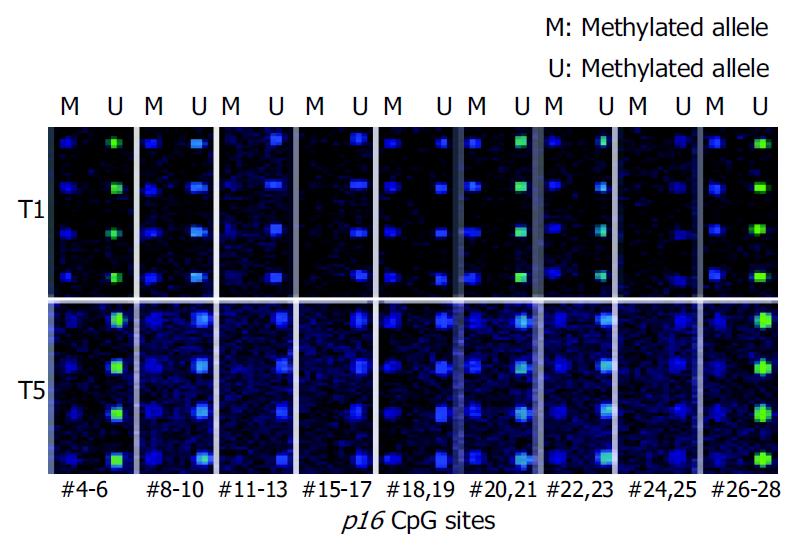
Figure 4 Methylation analysis of 23 CpG sites in p16 gene CpG island using oligonucleotide microarray.
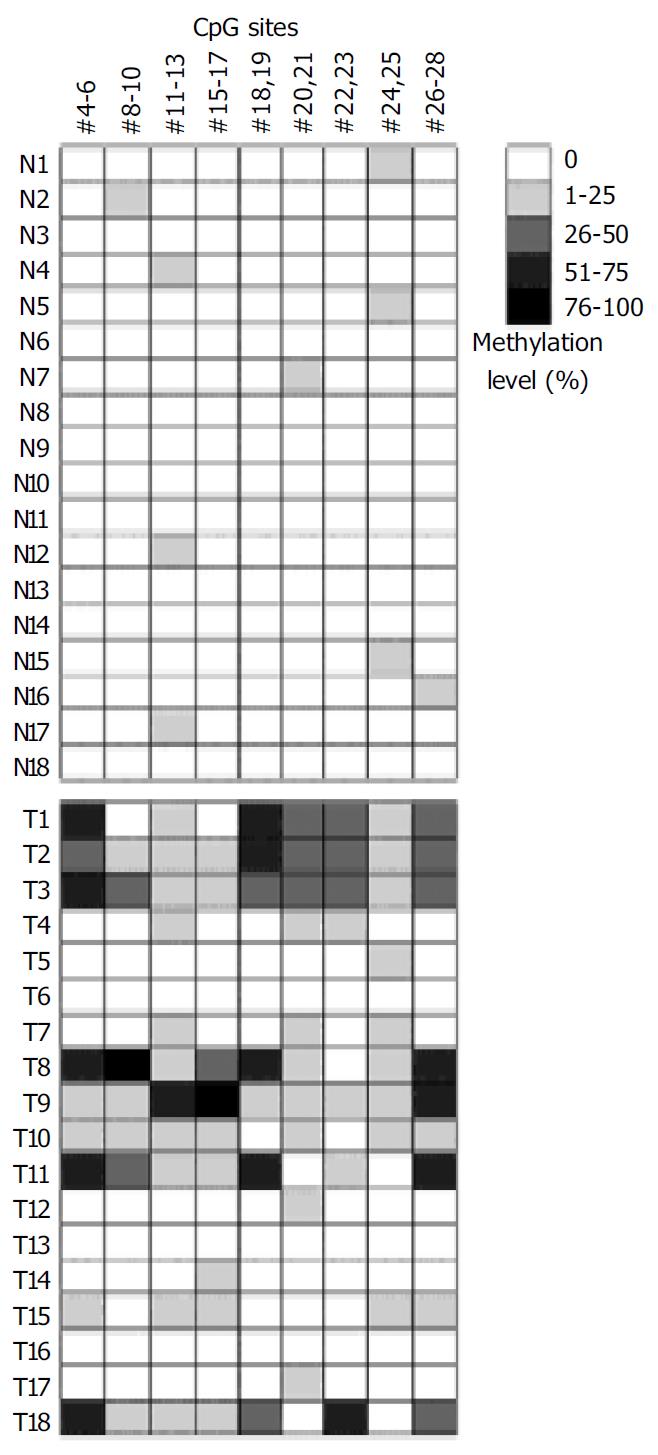
Figure 5 Methylation analysis of p16 gene CpG islands by oligonucleotide microarray.
Summaries of the microarray results are shown for 18 gastric tumors and corresponding normal tissues. Gray scale shown at right represents the me-thylation levels in percentage determined from the calibra-tion curve for the test CpG sites.
Figure 6 MSP analysis of the p16 gene CpG island in gastric tumor (T) and corresponding normal (N) tissues.
M and U indicate amplification using methylated and unmethylated sequence-specific primers, respectively. DNA extracted from tumor and the corresponding normal tissues were amplified with primers MS and MA1 (A) and MS and MA2 (B), respectively. (Pos) Positive control; (Neg) negative control; (Mr.) DNA marker.
- Citation: Hou P, Shen JY, Ji MJ, He NY, Lu ZH. Microarray-based method for detecting methylation changes of p16Ink4a gene 5’-CpG islands in gastric carcinomas. World J Gastroenterol 2004; 10(24): 3553-3558
- URL: https://www.wjgnet.com/1007-9327/full/v10/i24/3553.htm
- DOI: https://dx.doi.org/10.3748/wjg.v10.i24.3553


