©The Author(s) 2004.
World J Gastroenterol. Nov 15, 2004; 10(22): 3365-3368
Published online Nov 15, 2004. doi: 10.3748/wjg.v10.i22.3365
Published online Nov 15, 2004. doi: 10.3748/wjg.v10.i22.3365
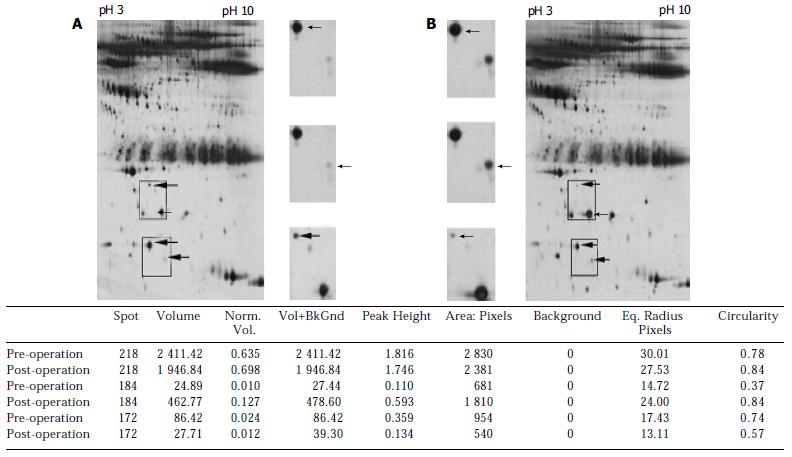
Figure 1 Representative of two-dimensional electrophoresis profiles and three-matched protein spots (arrows) analysis of the sera from esophageal squamous cell carcinoma patients before (A) and after (B) operation with different acidity from pH3 to pH10.
Norm: normalization, Vol: volume, BkGnd: background, Eq: equality.
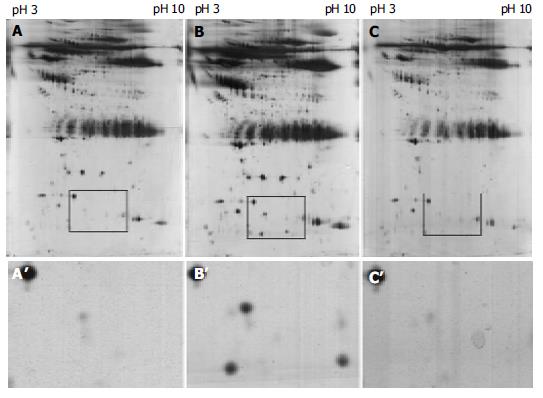
Figure 2 Representative of two-dimensional electrophoresis patterns of sera protein from the same esophageal squamous cell carcinoma patient before (A) and after (B) operation and the normal subject (C) with different acidity from pH3 to pH10.
A’, B’ and C’ are the magnification of A, B and C, respectively, for the sera protein with marked difference.
- Citation: An JY, Fan ZM, Zhuang ZH, Qin YR, Gao SS, Li JL, Wang LD. Proteomic analysis of blood level of proteins before and after operation in patients with esophageal squamous cell carcinoma at high-incidence area in Henan Province. World J Gastroenterol 2004; 10(22): 3365-3368
- URL: https://www.wjgnet.com/1007-9327/full/v10/i22/3365.htm
- DOI: https://dx.doi.org/10.3748/wjg.v10.i22.3365


