©The Author(s) 2004.
World J Gastroenterol. Jan 15, 2004; 10(2): 172-176
Published online Jan 15, 2004. doi: 10.3748/wjg.v10.i2.172
Published online Jan 15, 2004. doi: 10.3748/wjg.v10.i2.172
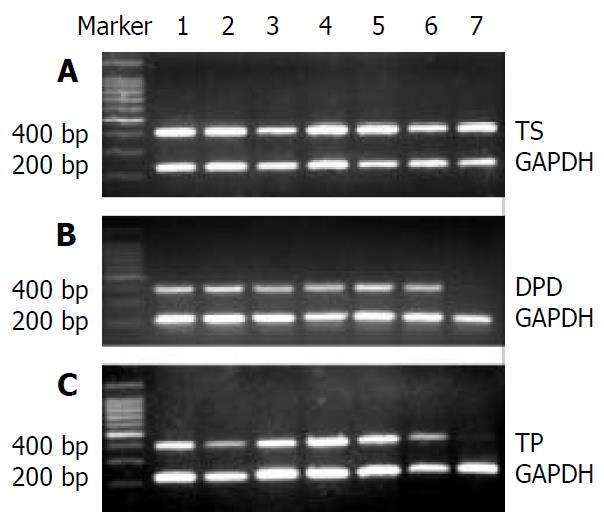
Figure 1 mRNA expression of seven gastrointestinal cancer cell lines by RT-PCR.
(A) the bands of TS and GAPDH; (B) the bands of DPD and GAPDH; (C) the bands of TP and GAPDH (1-MKN45; 2-SGC7901; 3-MKN28; 4-AGS; 5-SW1116; 6-Lovo; 7-HCT-8). The relative amount of mRNA was expressed as the intensity ratio of TS/DPD/TP to GAPDH RT-PCR products, as showed in Table 2.
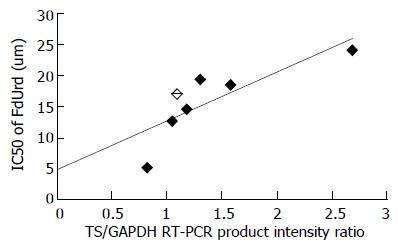
Figure 2 Linear regression for the sensitivity to FdUrd as a function of TS mRNA level (FdUrd-IC50 = 7.
89TS mRNA+4.77, r = 0.81, P = 0.028). Scatter plot shows the corrlation between TS mRNA levels and IC50 of FdUrd.
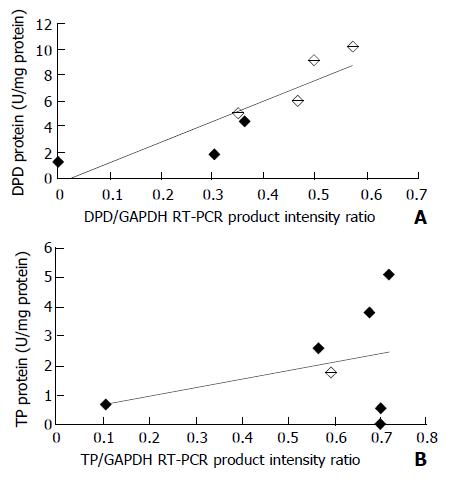
Figure 3 (A) Correlation between mRNA and protein level of DPD (r = 0.
88, P = 0.009); (B) Correlation between mRNA and protein level of TP (r = 0.33, P = 0.466).
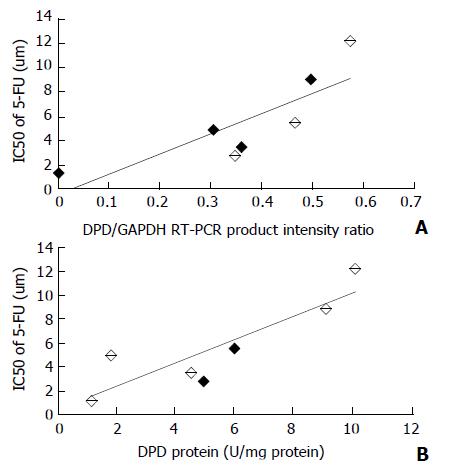
Figure 4 (A) Linear regression for the sensitivity to 5-FU as a function of DPD mRNA level (5-FU-IC50 = 16.
77DPD mRNA-0.54, r = 0.82, P = 0.025). (B) Linear regression for the sensitivity to
- Citation: Ma T, Zhu ZG, Ji YB, Zhang Y, Yu YY, Liu BY, Yin HR, Lin YZ. Correlation of thymidylate synthase, thymidine phosphorylase and dihydropyrimidine dehydrogenase with sensitivity of gastrointestinal cancer cells to 5-fluorouracil and 5-fluoro-2’-deoxyuridine. World J Gastroenterol 2004; 10(2): 172-176
- URL: https://www.wjgnet.com/1007-9327/full/v10/i2/172.htm
- DOI: https://dx.doi.org/10.3748/wjg.v10.i2.172


