©The Author(s) 2004.
World J Gastroenterol. Sep 15, 2004; 10(18): 2744-2746
Published online Sep 15, 2004. doi: 10.3748/wjg.v10.i18.2744
Published online Sep 15, 2004. doi: 10.3748/wjg.v10.i18.2744
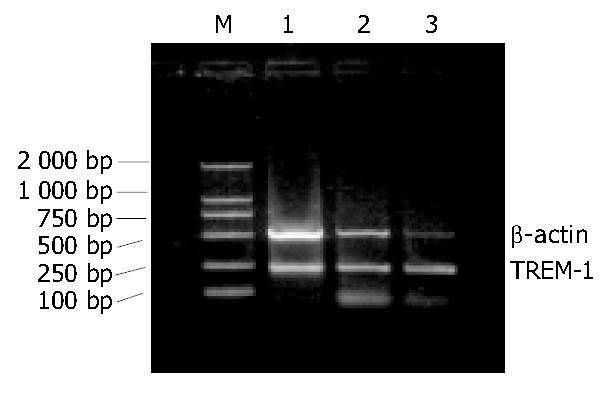
Figure 1 Electrophoresis of the PCR products.
M: DL2000 marker; 1: the PCR product of normal subject; 2: the PCR product of MAP; 3: the PCR product of SAP. The amplified fragment lengths of β-actin and TREM-1 are 520 bp and 232 bp respectively.
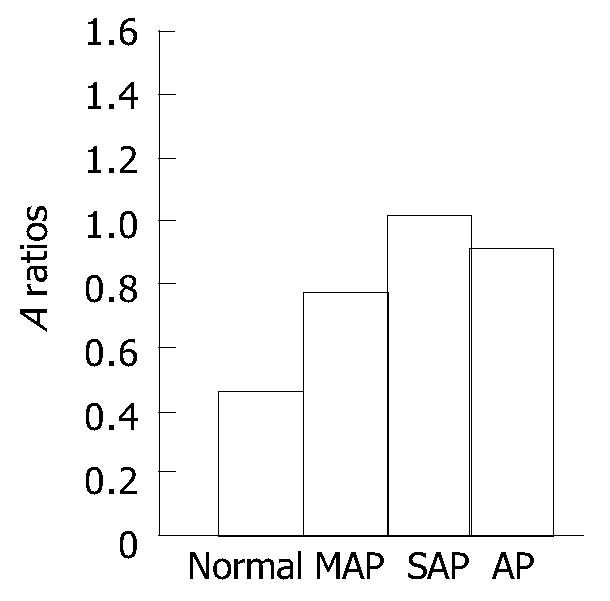
Figure 2 The A ratios of TREM-1/β-actin in different degree of AP: There was a significant difference among the three groups in the expressions of TREM-1 mRNA (P < 0.
05). And between the AP patients and healthy control subjects, the difference was significant (P < 0.05).
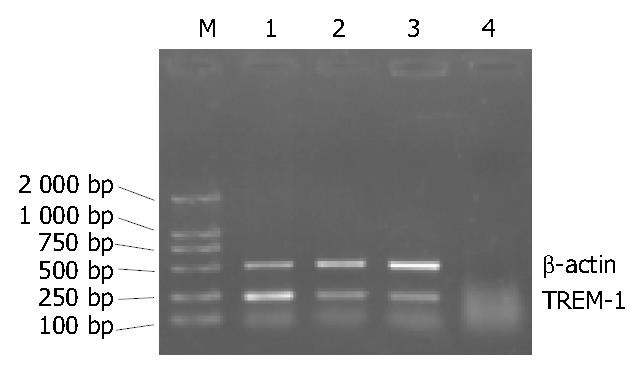
Figure 3 Electrophoresis of the PCR products.
M: DL2000 marker; 1: the AP patient before treatment; 2: the same patient after successful therapy; 3: the same AP patient after clinically cured; 4: negative control. The amplified fragment length of β-actin is 520 bp, of TREM-1 is 232 bp. 10 g/L agarose gel.
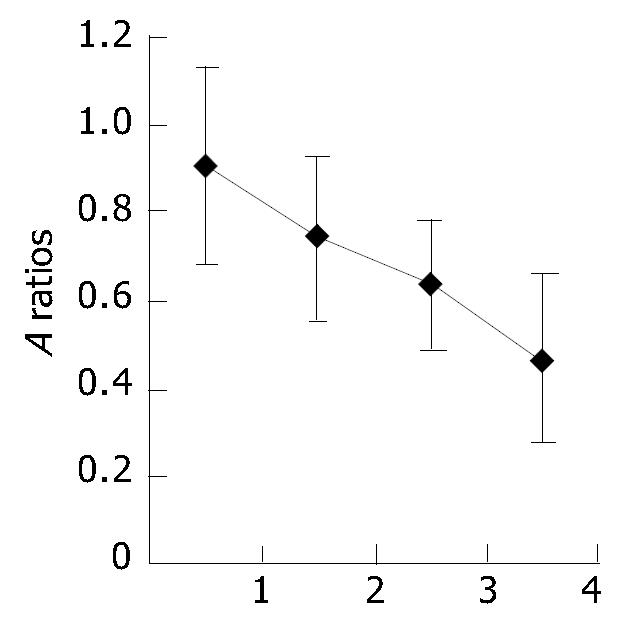
Figure 4 The A ratios of TREM-1/β-actin in different stage of AP: 1, the group in the stage of before treatment.
2, the group in the stage after successful therapy. 3, the group in the stage of clinically cured. 4, the group of normal subject. There was a significant difference among the three stages in the expression of TREM-1 mRNA (groups 1, 2 and 3. P < 0.05). And in the group of clinically cured the ratio was higher than in healthy control subjects (P < 0.05).
- Citation: Wang DY, Qin RY, Liu ZR, Gupta MK, Chang Q. Expression of TREM-1 mRNA in acute pancreatitis. World J Gastroenterol 2004; 10(18): 2744-2746
- URL: https://www.wjgnet.com/1007-9327/full/v10/i18/2744.htm
- DOI: https://dx.doi.org/10.3748/wjg.v10.i18.2744


