Copyright
©The Author(s) 2004.
World J Gastroenterol. Aug 15, 2004; 10(16): 2344-2351
Published online Aug 15, 2004. doi: 10.3748/wjg.v10.i16.2344
Published online Aug 15, 2004. doi: 10.3748/wjg.v10.i16.2344
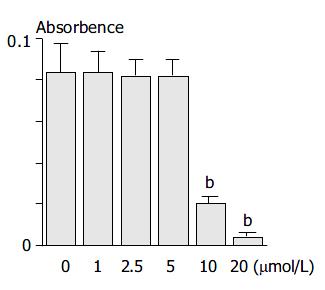
Figure 1 PSCs were incubated with HNE at the indicated con-centrations in serum-free medium for 24 h.
Cell viability was determined by the MTT assay, and the absorbance at 570 min 690 nm (“A.”) of the sample is given. Data are shown as mean ± SD (n = 6). aP < 0.05 vs control, bP < 0.01 vs control.
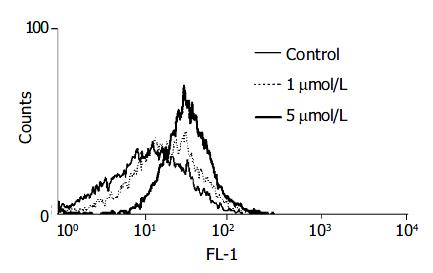
Figure 2 PSCs were incubated with DCF-DA (at 50 μmol/L ) for 30 min and then treated with HNE (at 1 or 5 μmol/L) for 30 min.
The fluorescence intensity of more than 10000 cells was analyzed using a flow cytometer.
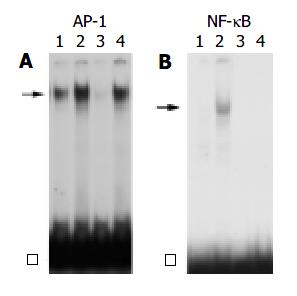
Figure 3 PSCs were treated with IL-1β (at 2 ng/mL, lane 2) or HNE (at 5 μmol/L, lane 4) in serum-free medium for 1 h.
Nuclear extracts were prepared and subjected to electro-phoretic mobility shift assay using AP-1 (panel A) or NF-κB (panel B) oligonucleotide probes. Arrows denote specific in-ducible complexes competitive with cold double-stranded oli-gonucleotide probes (lane 3). Lane 1: control (serum-free medium only). □: free probe.
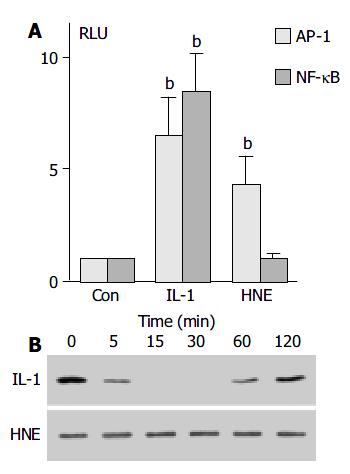
Figure 4 HNE increased AP-1, but not NF-κB, -dependent transcriptional activity.
A: PSCs were transfected with the lu-ciferase vectors (2 X AP-1 or 2 X NF-κB) along with pRL-TK vector as an internal control. After 24 h, the transfected cells were treated with IL-1β (at 2 ng/mL) or HNE (at 1 μmol/L ). After another 24-h incubation, intracellular luciferase activities were determined. The data represent mean mean ± SD, calcu-lated from three independent experiments as fold induction compared with the activity observed in control (serum-free medium only, “Con”). bP < 0.01 vs control. RLU: relative light units. B: PSCs were treated with IL-1β (at 2 ng/mL) or HNE (at 1 μmol/L) in serum-free medium for the indicated times. Total cell lysates were prepared, and the level of IκB-α was deter-mined by Western blotting.
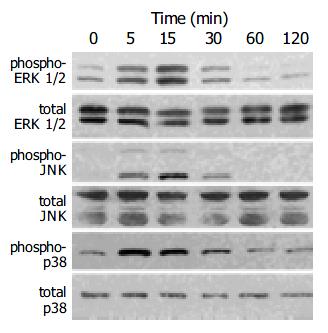
Figure 5 PSCs were treated with HNE (at 1 μmol/L) for the indicated times.
Total cell lysates (approximately 100 μg) were prepared, and the levels of activated, phosphorylated MAP kinases were determined by Western blotting using anti- phosphospecific antibodies. Levels of total MAP kinases were also determined.
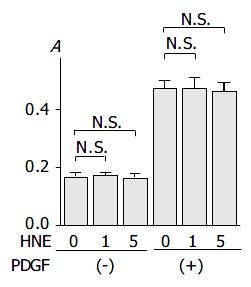
Figure 6 PSCs were treated with HNE (at 0, 1, or 5 μmol/L ) in the absence or presence of PDGF (at 25 ng/mL) in serum-free medium.
After 24-h incubation, cells were labeled with BrdU for 3 h. Cells were fixed, and incubated with peroxidase-conju-gated anti-BrdU antibody. Then the peroxidase substrate 3,3’, 5,5’-tetramethylbenzidine was added, and BrdU incorporation was quantitated by differences in absorbance at wavelength 370 min 492 nm (“A.”, optical density). Data are shown as mean ± SD (n = 6). bP < 0.01 versus control (serum-free medium only), N.S.: not significant.
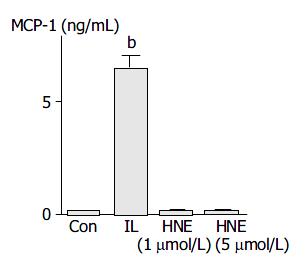
Figure 7 PSCs were treated with IL-1β (2 ng/mL, “IL”) or HNE (at 1 or 5 µmol/L ) in serum-free medium.
After 24 h, culture supernatant was harvested, and the MCP-1 level was determined by enzyme-linked immunosorbent assay. Data shown are expressed as mean ± SD (n = 6). bP < 0.01 versus con-trol (“Con”, serum-free medium only).
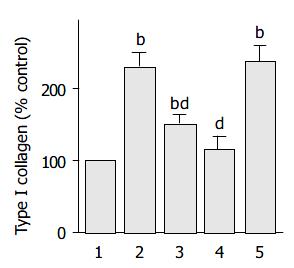
Figure 8 PSCs were treated with HNE (at 1 µmol/L , lane 2) in the absence or presence of SB203580 (at 25 mmol/L , lane 3), SP600125 (at 10 µmol/L, lane 4), or U0126 (at 5 µmol/L, lane 5).
After 48-h incubation, type I collagen released into the cultute supernatant was quantified by enzyme-linked immunosorbent assay. The collagen levels in each sample were normalized to the cellular DNA content. The results are expressed as a per-centage of the untreated control (“Con”). Data are shown as mean ± SD (n = 6). bP < 0.01 vs control (serum-free medium only, lane 1). dP < 0.01 vs HNE only (lane 2).
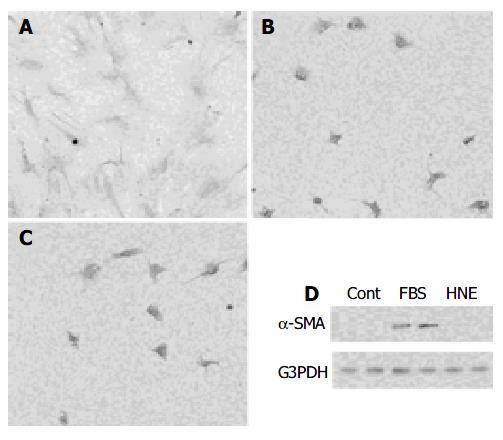
Figure 9 A,B,C: Freshly isolated PSCs were incubated with 50 mL/L serum (panel A), HNE (at 1 µmol/L, panel B), or serum-free medium (panel C) for 7 d.
Morphological changes characteristic of PSC activation were assessed after staining with GFAP. Original magnification: × 10 objective. D: Total cell lysates (approximately 25 µg) were prepared from cells treated with serum-free medium (“Cont”), 50 mL/L serum (“FBS”), or HNE (at 1 µmol/L) for 7 d, and the levels of α -SMA and G3PDH were determined by Western blotting.
- Citation: Kikuta K, Masamune A, Satoh M, Suzuki N, Shimosegawa T. 4-hydroxy-2, 3-nonenal activates activator protein-1 and mitogen-activated protein kinases in rat pancreatic stellate cells. World J Gastroenterol 2004; 10(16): 2344-2351
- URL: https://www.wjgnet.com/1007-9327/full/v10/i16/2344.htm
- DOI: https://dx.doi.org/10.3748/wjg.v10.i16.2344


