Copyright
©The Author(s) 2004.
World J Gastroenterol. Jul 1, 2004; 10(13): 1876-1880
Published online Jul 1, 2004. doi: 10.3748/wjg.v10.i13.1876
Published online Jul 1, 2004. doi: 10.3748/wjg.v10.i13.1876
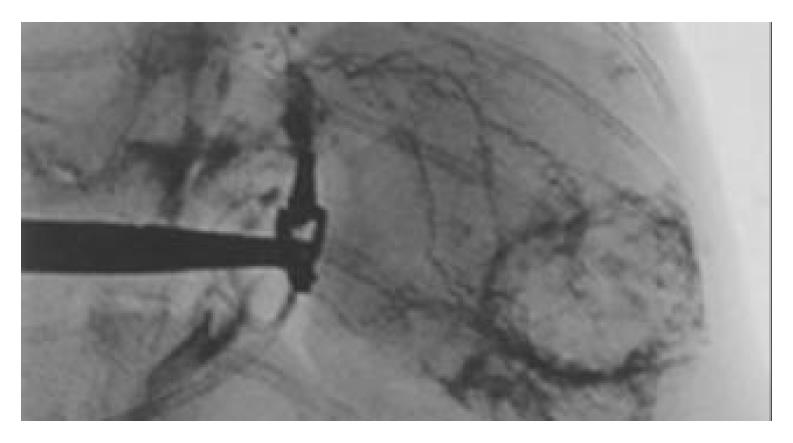
Figure 1 Hepatic arteriography of rabbits.
There was increased angiogenesis with thickening and irregularity of the vessels. There was also tumor staining mainly in the periphery of the tumor.
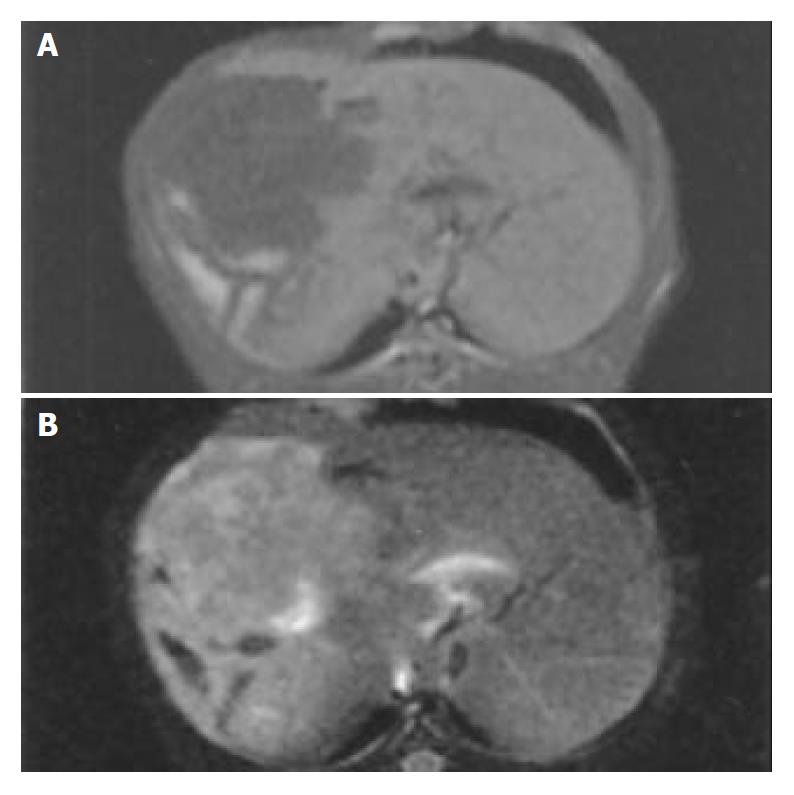
Figure 2 MRI of rabbit liver.
The tumor appeared hypointense on T1WI (A) and hyperintense on T2WI (B).
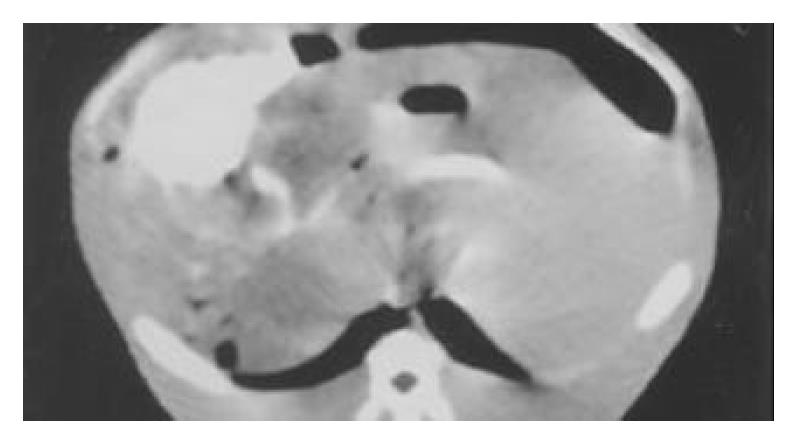
Figure 3 CT scan shows massive retention of iodized oil in tumor after TACE.
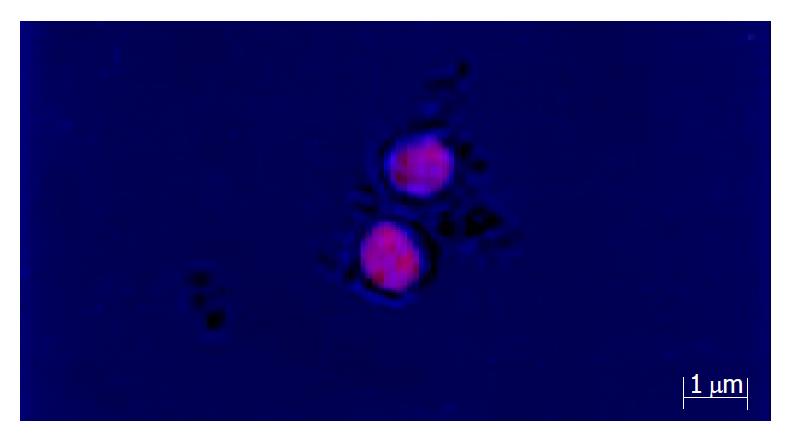
Figure 4 Cells giving out red fluorescent light under laser confocal microscope.
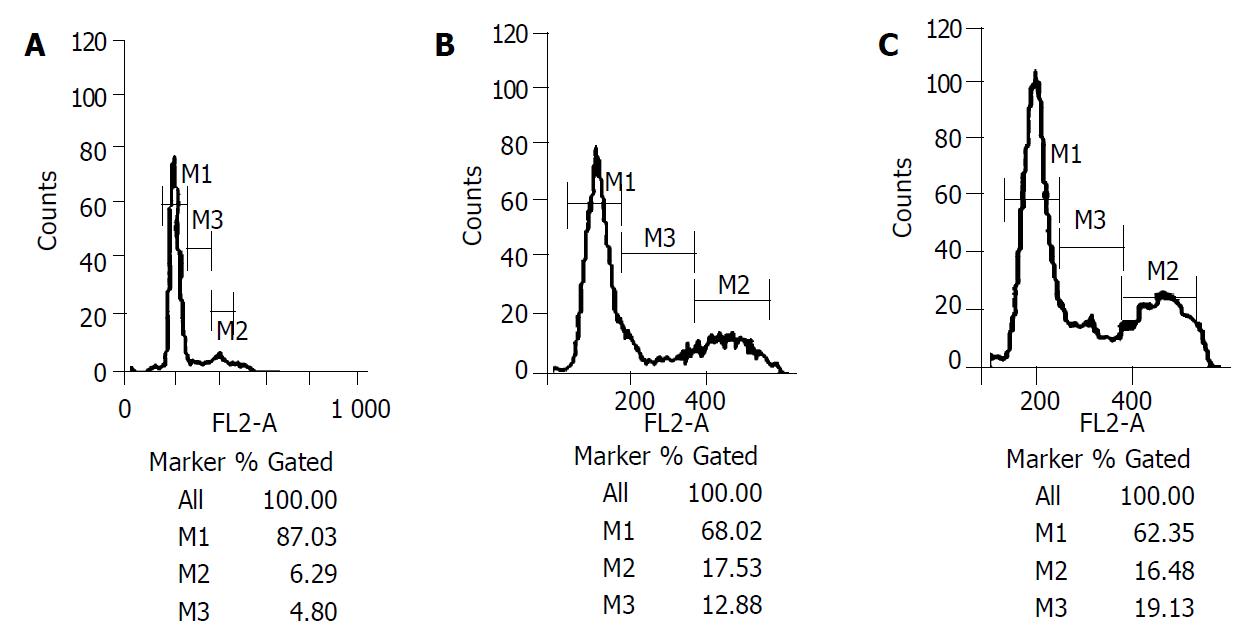
Figure 5 A: Shows the S phase and G2/M phase cells were small in proportion on the first day after operations (4.
80%, 6.29%) in control group. B: Shows the S phase and G2/M phase cells grew much more on the first day after operations (17.53%, 12.88%) in TACE group. C: Shows the S phase and G2/M phase cells grew much more on the first day after operations (16.48%, 19.13%) in PH group. *M1 is G0/G1 phase cell ratio/M2 is G2/M phase cell ratio, M3 is S phase cell ratio.
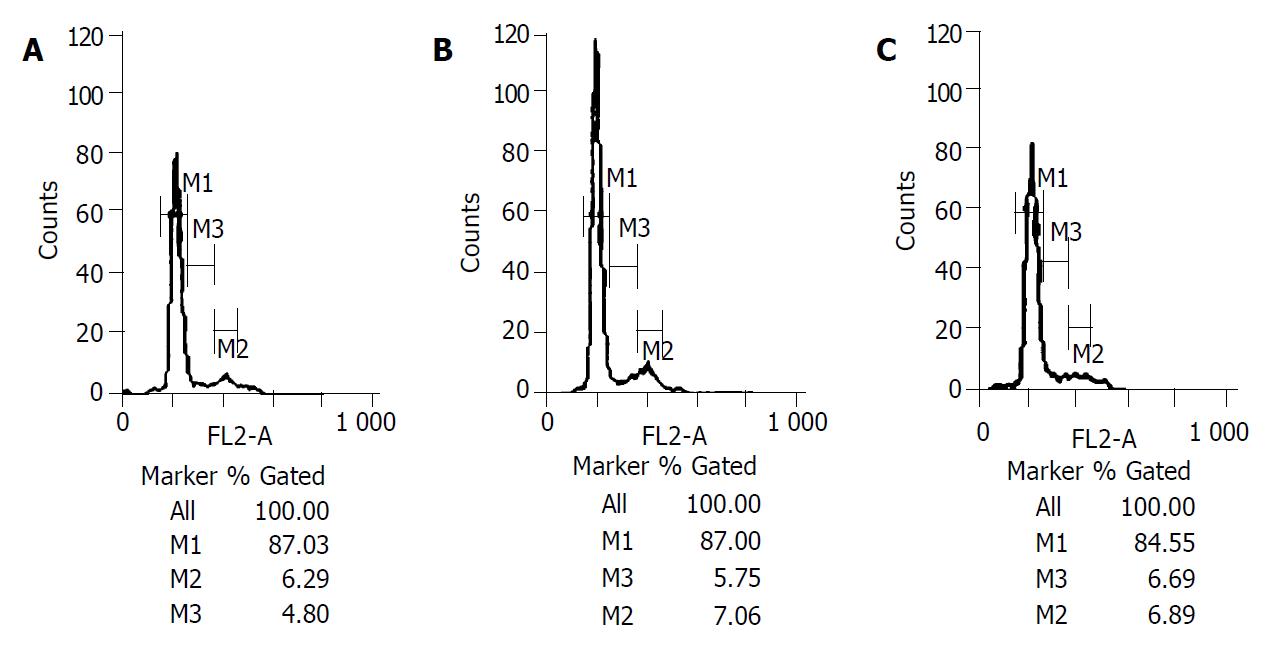
Figure 6 A: Shows the S phase and G2/M phase cells were small in proportion on the third day after operations (4.
80%, 6.29%) in control group. B and C: Show the S phase and G2/M phase cells had slight changes on the third day after operations in TACE group and PH group.
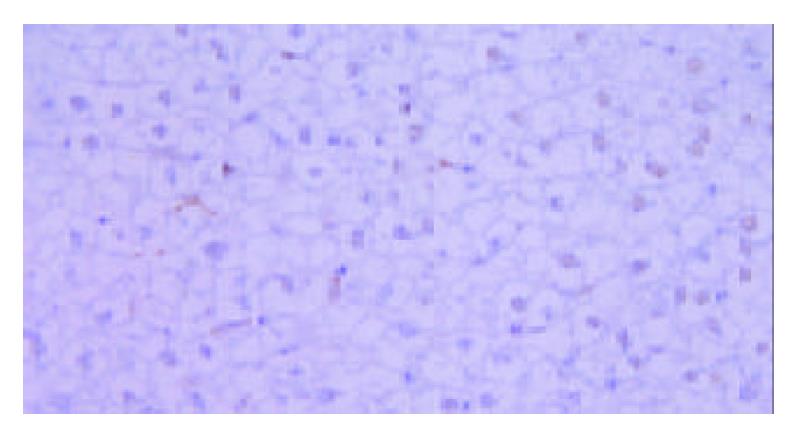
Figure 7 Analysis of apoptosis cells by TUNEL method in TACE group.
The nuclei of apoptosis cells appeared brown while those of normal cells appeared blue. It was found that part of the cells were apoptotic cells.
- Citation: Li Z, Hu DY, Chu Q, Wu JH, Gao C, Zhang YQ, Huang YR. Cell apoptosis and regeneration of hepatocellular carcinoma after transarterial chemoembolization. World J Gastroenterol 2004; 10(13): 1876-1880
- URL: https://www.wjgnet.com/1007-9327/full/v10/i13/1876.htm
- DOI: https://dx.doi.org/10.3748/wjg.v10.i13.1876


