Copyright
©The Author(s) 2004.
World J Gastroenterol. Jun 1, 2004; 10(11): 1594-1599
Published online Jun 1, 2004. doi: 10.3748/wjg.v10.i11.1594
Published online Jun 1, 2004. doi: 10.3748/wjg.v10.i11.1594
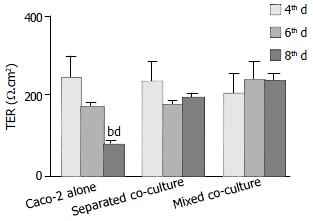
Figure 1 Comparison of time-dependent changes in transepithelial resistance (TER) of different culture groups.
Data in all panels are mean ± SE for 4 experiments, significant differences relative to its own 4-d of culture in Caco-2 alone (bP < 0.01), and to its own 6th day culture of Caco-2 alone (dP < 0.001) are indicated.
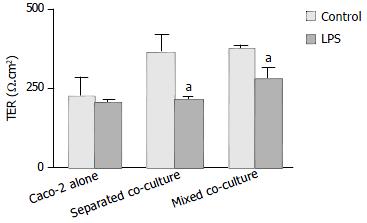
Figure 2 Effect of Shigella F2a-12 LPS on transepithelial resis-tance (TER) of different culture groups.
Cultured monolayers were exposed to LPS 48-h prior to TER measurement on the 6 d of culture. Comparison of TER in the absence or presence of Shigella F2a-12 LPS among the three culture groups. The values indicate mean ± SE; n = 5; aP < 0.05 (compared to its own control).
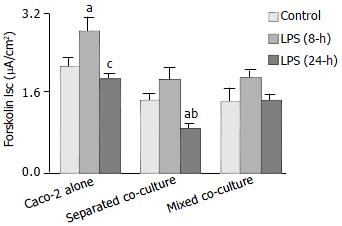
Figure 3 Effect of Shigella F2a-12 LPS on the Forskolin-induced Isc.
Comparison of the Forskolin (4 mg/mL, basoateral addition) -induced Isc in the absence or presence of LPS for 8-h and 24-h under different culture conditions. The values indicate mean ± SE; n = 12; aP < 0.05 (compared to its own control) ; cP < 0.05 and bP < 0.001 (compared to its own LPS treatment for 8-h).
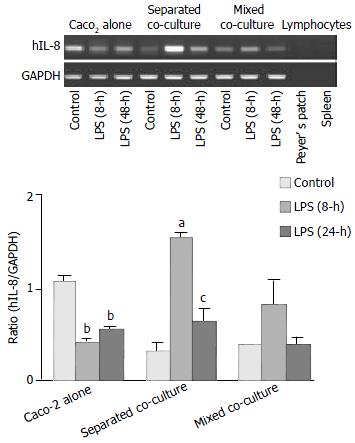
Figure 4 Induction of hIL-8 expression in Caco-2 cells by Shi-gella F2a-12 LPS in different culture groups.
Comparison of hIL-8 expression in Caco-2 cells in the absence or presence of LPS for 8-h and 24-h between three culture groups by semi-quantitative RT-PCR with Peyer’s patch lymphocytes as nega-tive control. The values indicate mean ± SE; aP < 0.05, bP < 0.01 (compared to its own control) ; cP < 0.05 (compared to separated co-culture LPS pre-treatment for 8-h).
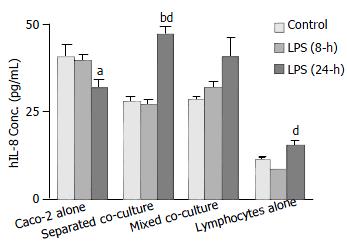
Figure 5 Comparison of Shigella F2a-12 LPS-induced hIL-8 release from different culture groups by ELISA.
Culture groups and Peyer’s patch lymphocytes alone (control, 1 × 10⁶ cells) were treated with LPS for 8-h and 24-h. The presented values indicate mean ± SE; n = 8; bP < 0.001 (compared to its own control) ; aP < 0.05 and dP < 0.001 (compared to its own LPS treatment for 8-h).
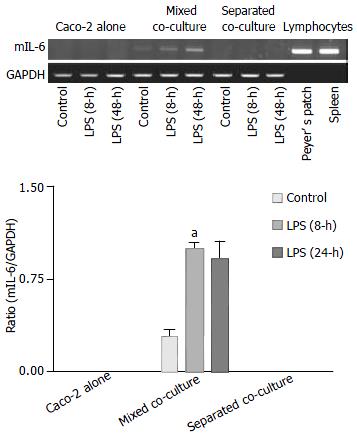
Figure 6 Induction of mIL-6 expression by Shigella F2a-12 LPS in different culture groups.
Comparison of mIL-6 expression in the absence or presence of LPS for 8-h and 24-h among the culture groups by semi-quantitative RT-PCR with mouse Peyer’s patch lymphocytes as positive control. The values indicate mean ± SE aP < 0.01 (compared to the mixed control).
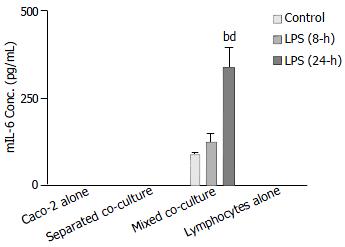
Figure 7 Comparison of Shigella F2a-12 LPS-induced mIL-6 release from different culture groups by ELISA.
Culture groups and Peyer’s patch lymphocytes (1 × 10⁶ cells) were treated with LPS for 8-h and 24-h. The values indicate mean ± SE; n = 5; bP < 0.01 (compared to mixed co-culture control) and dP < 0.01 (compared to the mixed LPS treatment for 8-h).
- Citation: Chen J, Tsang LL, Ho LS, Rowlands DK, Gao JY, Ng CP, Chung YW, Chan HC. Modulation of human enteric epithelial barrier and ion transport function by Peyer’s patch lymphocytes. World J Gastroenterol 2004; 10(11): 1594-1599
- URL: https://www.wjgnet.com/1007-9327/full/v10/i11/1594.htm
- DOI: https://dx.doi.org/10.3748/wjg.v10.i11.1594


