Copyright
©The Author(s) 2004.
World J Gastroenterol. Jun 1, 2004; 10(11): 1565-1568
Published online Jun 1, 2004. doi: 10.3748/wjg.v10.i11.1565
Published online Jun 1, 2004. doi: 10.3748/wjg.v10.i11.1565
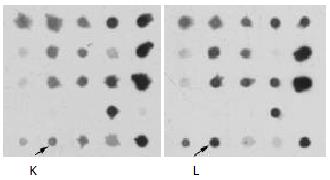
Figure 1 Differential expression profile of cDNA array hy-bridization result.
Part of the membrane is displayed. The clones the arrows point represent CYP2E1. K: HCC tissue, L: adjacent liver tissue.
Figure 2 CYP2E1 expression in normal human organs and HCC tissues detected by Northern blot analysis.
1: heart, 2: brain, 3: muscle, 4: intestine, 5: stomach, 6: lung, 7: liver tissues adjacent to HCC, 8: HCC, 9: liver tissues adjacent to HCC, 10: HCC, 11: renal tissues adjacent to carcinoma, 12: renal carcinoma.
Figure 3 CYP2E1 expression in normal organs of rat detected by RT-PCR analysis.
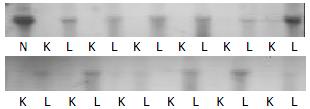
Figure 4 CYP2E1 expression in human HCC tissues detected by Northern blot analysis.
N: normal liver, K: HCC, L: liver tissue adjacent to HCC.
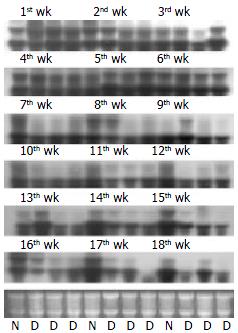
Figure 5 CYP2E1 expression in occurrence and development of rat HCC detected by Northern blot analysis.
There were 12 lanes in one membrane including specimen of 3 wk. Riboso-mal RNA of 28 s and 18 s as control was in the bottom. N: nor-mal control group, D: DENA-induced group.
-
Citation: Man XB, Tang L, Qiu XH, Yang LQ, Cao HF, Wu MC, Wang HY. Expression of
cytochrome P4502E1 gene in hepatocellular carcinoma. World J Gastroenterol 2004; 10(11): 1565-1568 - URL: https://www.wjgnet.com/1007-9327/full/v10/i11/1565.htm
- DOI: https://dx.doi.org/10.3748/wjg.v10.i11.1565


