Copyright
©The Author(s) 2004.
World J Gastroenterol. May 15, 2004; 10(10): 1476-1479
Published online May 15, 2004. doi: 10.3748/wjg.v10.i10.1476
Published online May 15, 2004. doi: 10.3748/wjg.v10.i10.1476
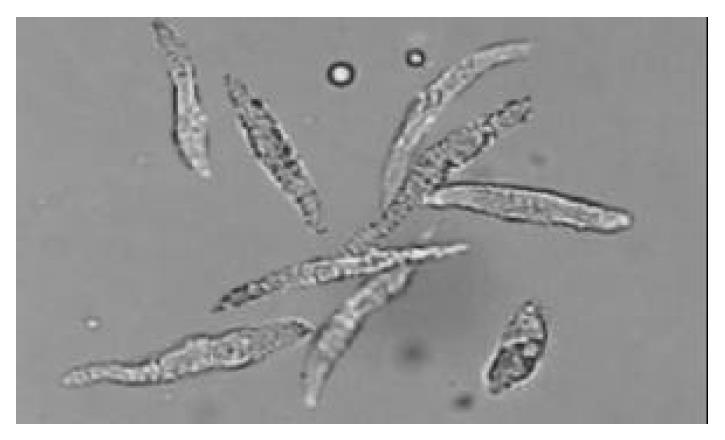
Figure 1 Freshly isolated colonic smooth muscle cells appeared in spindle shape with diverse length.
Some of them were re-laxed while others were at different phases of contraction.
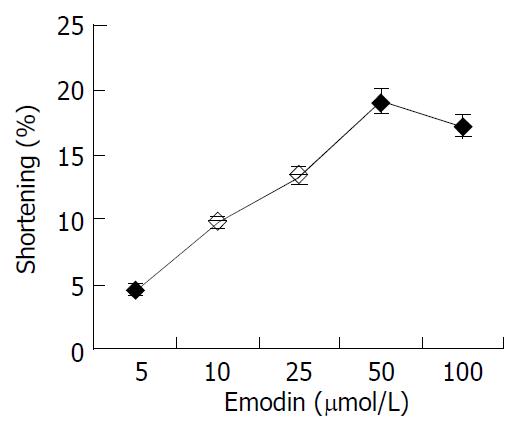
Figure 2 Dose-response curve representing the effects of emo-din on the length of isolated colonic smooth muscle cell.
Val-ues are mean ± SD of 3 experiments.
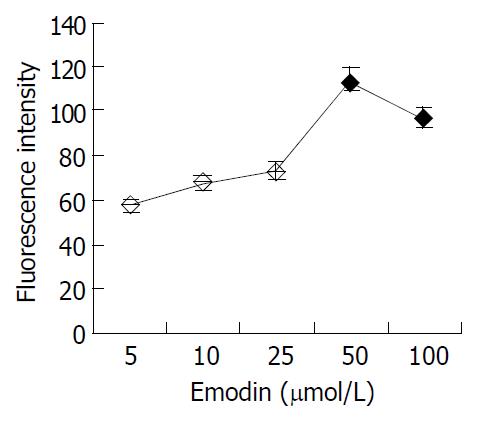
Figure 3 [Ca2+]i response of colonic smooth muscle cells to emodin.
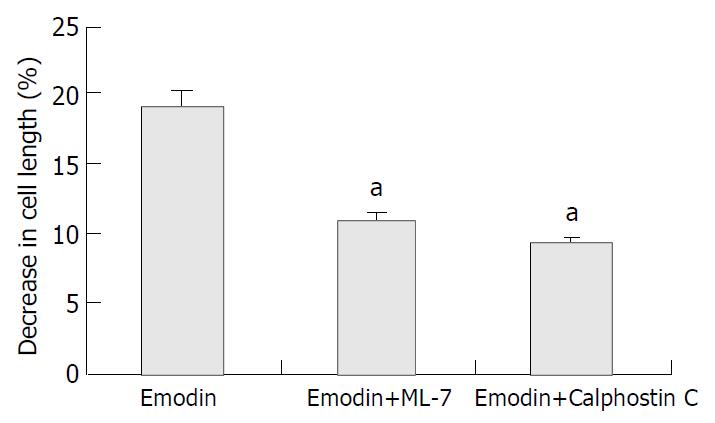
Figure 4 Effect of ML-7 and calphostin C on emodin-induced contraction of colonic smooth muscle cells.
Emodin-induced cell shortening was 19.17% ± 2.59%. Preincubation of the cells with ML-7 and calphostin C resulted in a decrease in cell contraction. aP < 0.05 vs Emodin group.
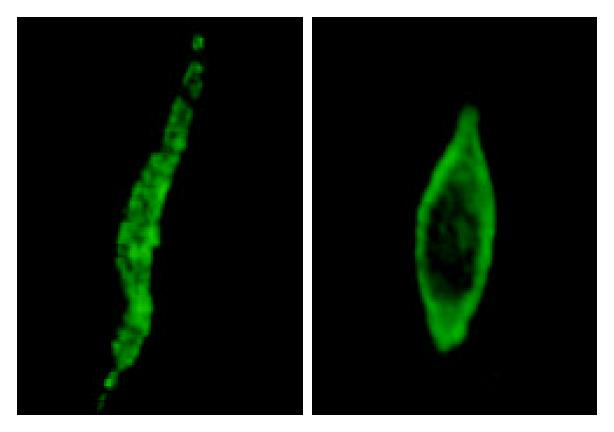
Figure 5 Membrane translocation of PKCα in response to emo-din stimulation in smooth muscle cells of rat colon.
Confocal microscopy showed PKCα distributed throughout the cell at rest state (left). When cells were stimulated with emodin (50 μmol/L), PKCα translocated to the membrane (right).
- Citation: Ma T, Qi QH, Xu J, Dong ZL, Yang WX. Signal pathways involved in emodin-induced contraction of smooth muscle cells from rat colon. World J Gastroenterol 2004; 10(10): 1476-1479
- URL: https://www.wjgnet.com/1007-9327/full/v10/i10/1476.htm
- DOI: https://dx.doi.org/10.3748/wjg.v10.i10.1476


