©The Author(s) 2025.
Artif Intell Gastrointest Endosc. Mar 28, 2025; 6(1): 105674
Published online Mar 28, 2025. doi: 10.37126/aige.v6.i1.105674
Published online Mar 28, 2025. doi: 10.37126/aige.v6.i1.105674
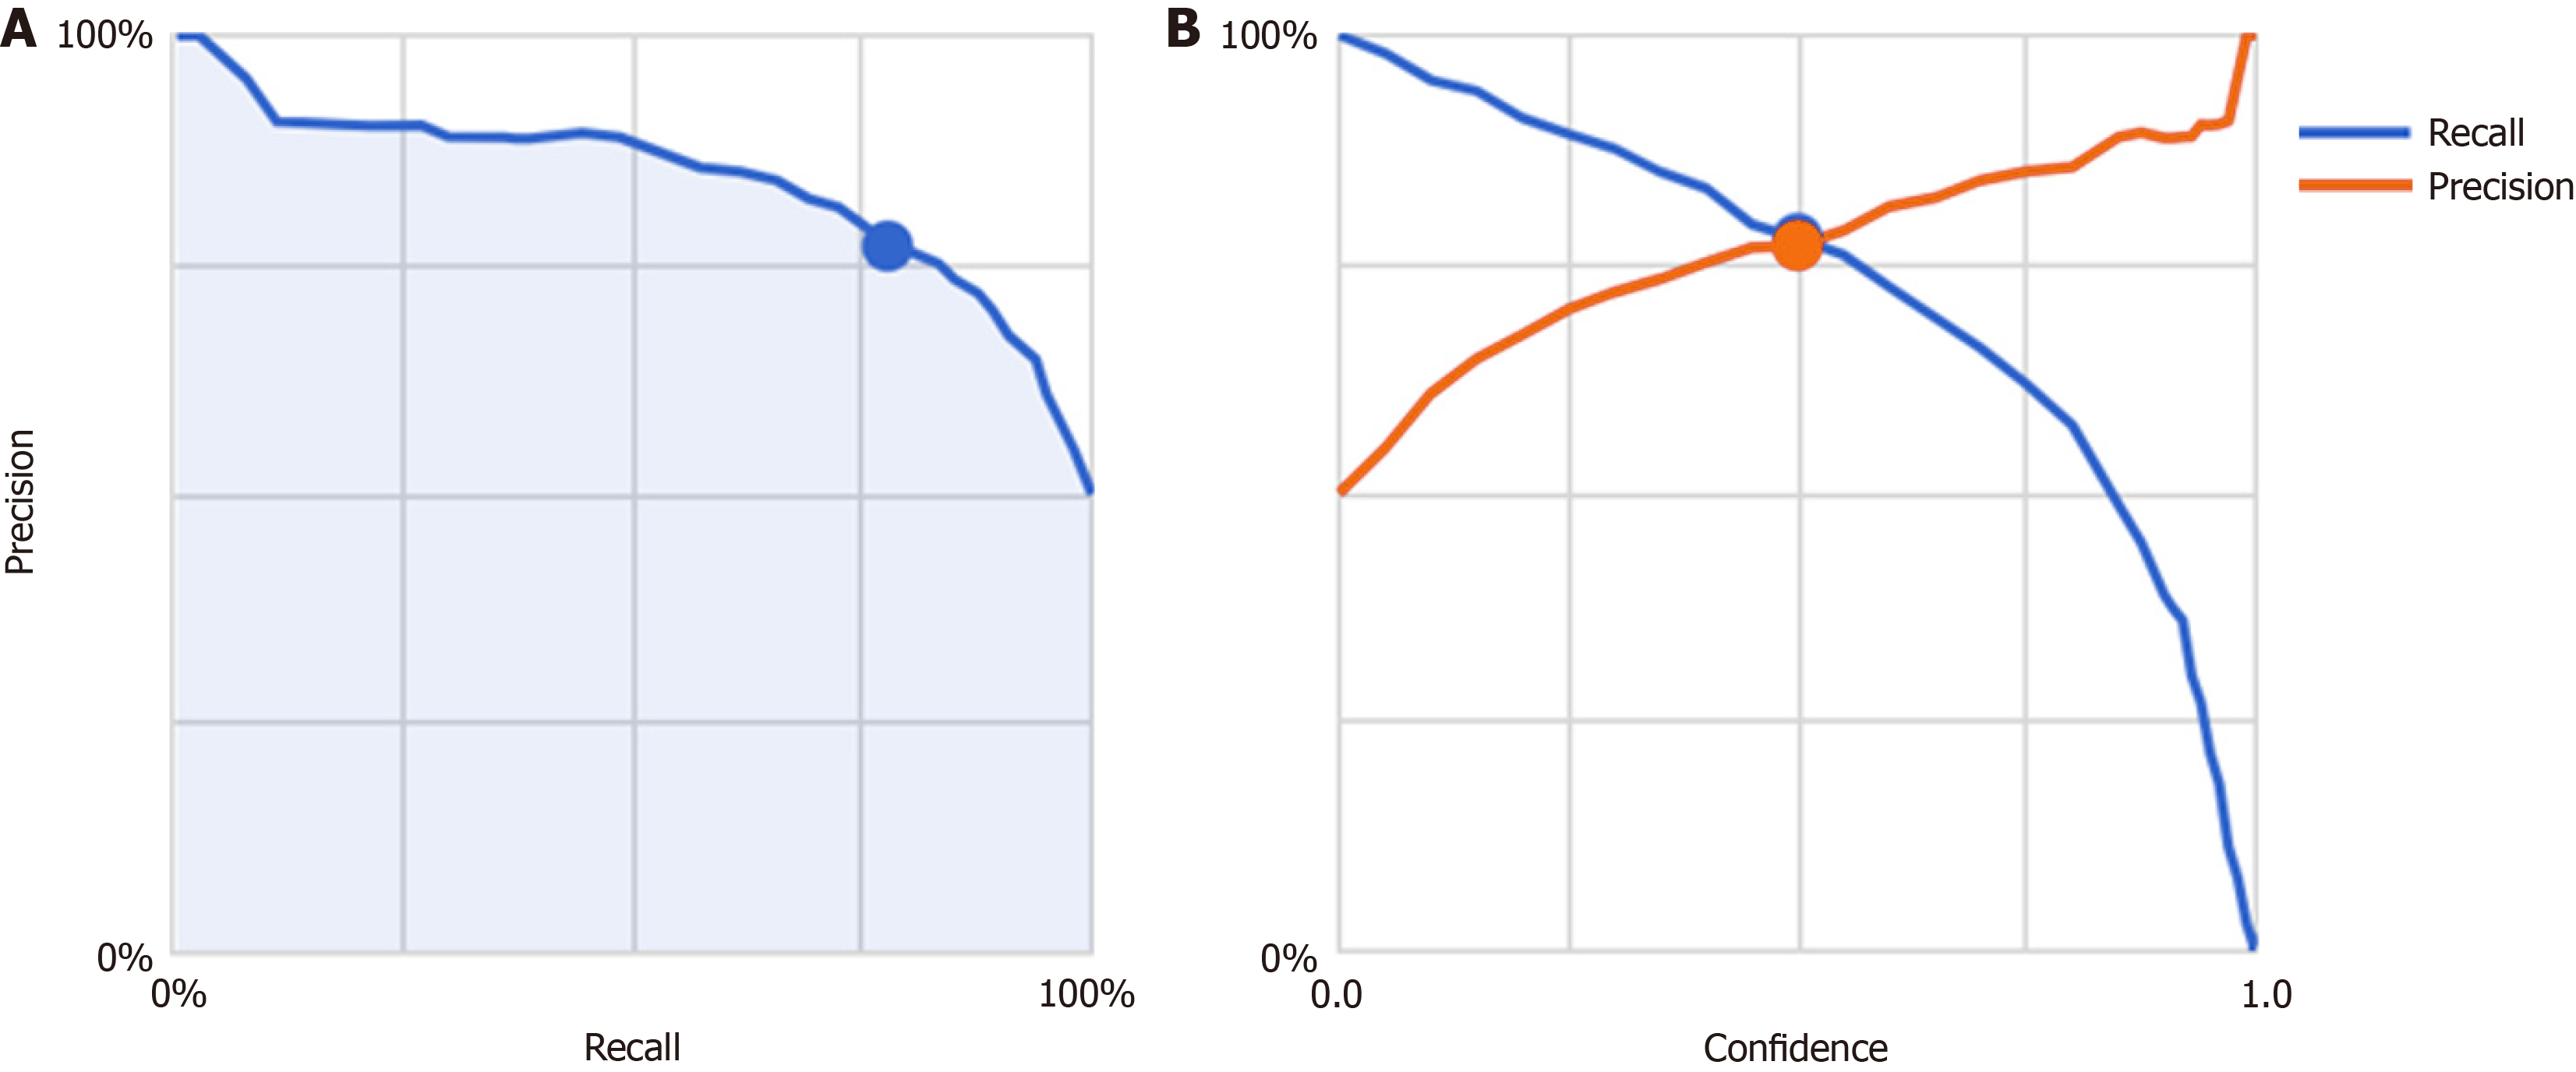
Figure 1 The precision of the functional dyspepsia/Helicobacter pylori groups duodenal image artificial intelligence model was plotted as a function of the recall.
A: The Precision-Recall Curve for the functional dyspepsia/Helicobacter pylori groups duodenal image artificial intelligence model. The blue shaded area represents the area under the curve is shown. The blue dot indicates the values when the reliability threshold was set to 0.5; B: The Precision and Recall by Threshold plot, which illustrates how precision (orange line) and recall (blue line) vary with different reliability thresholds. The blue and orange dots indicate the values when the reliability threshold was set to 0.5.
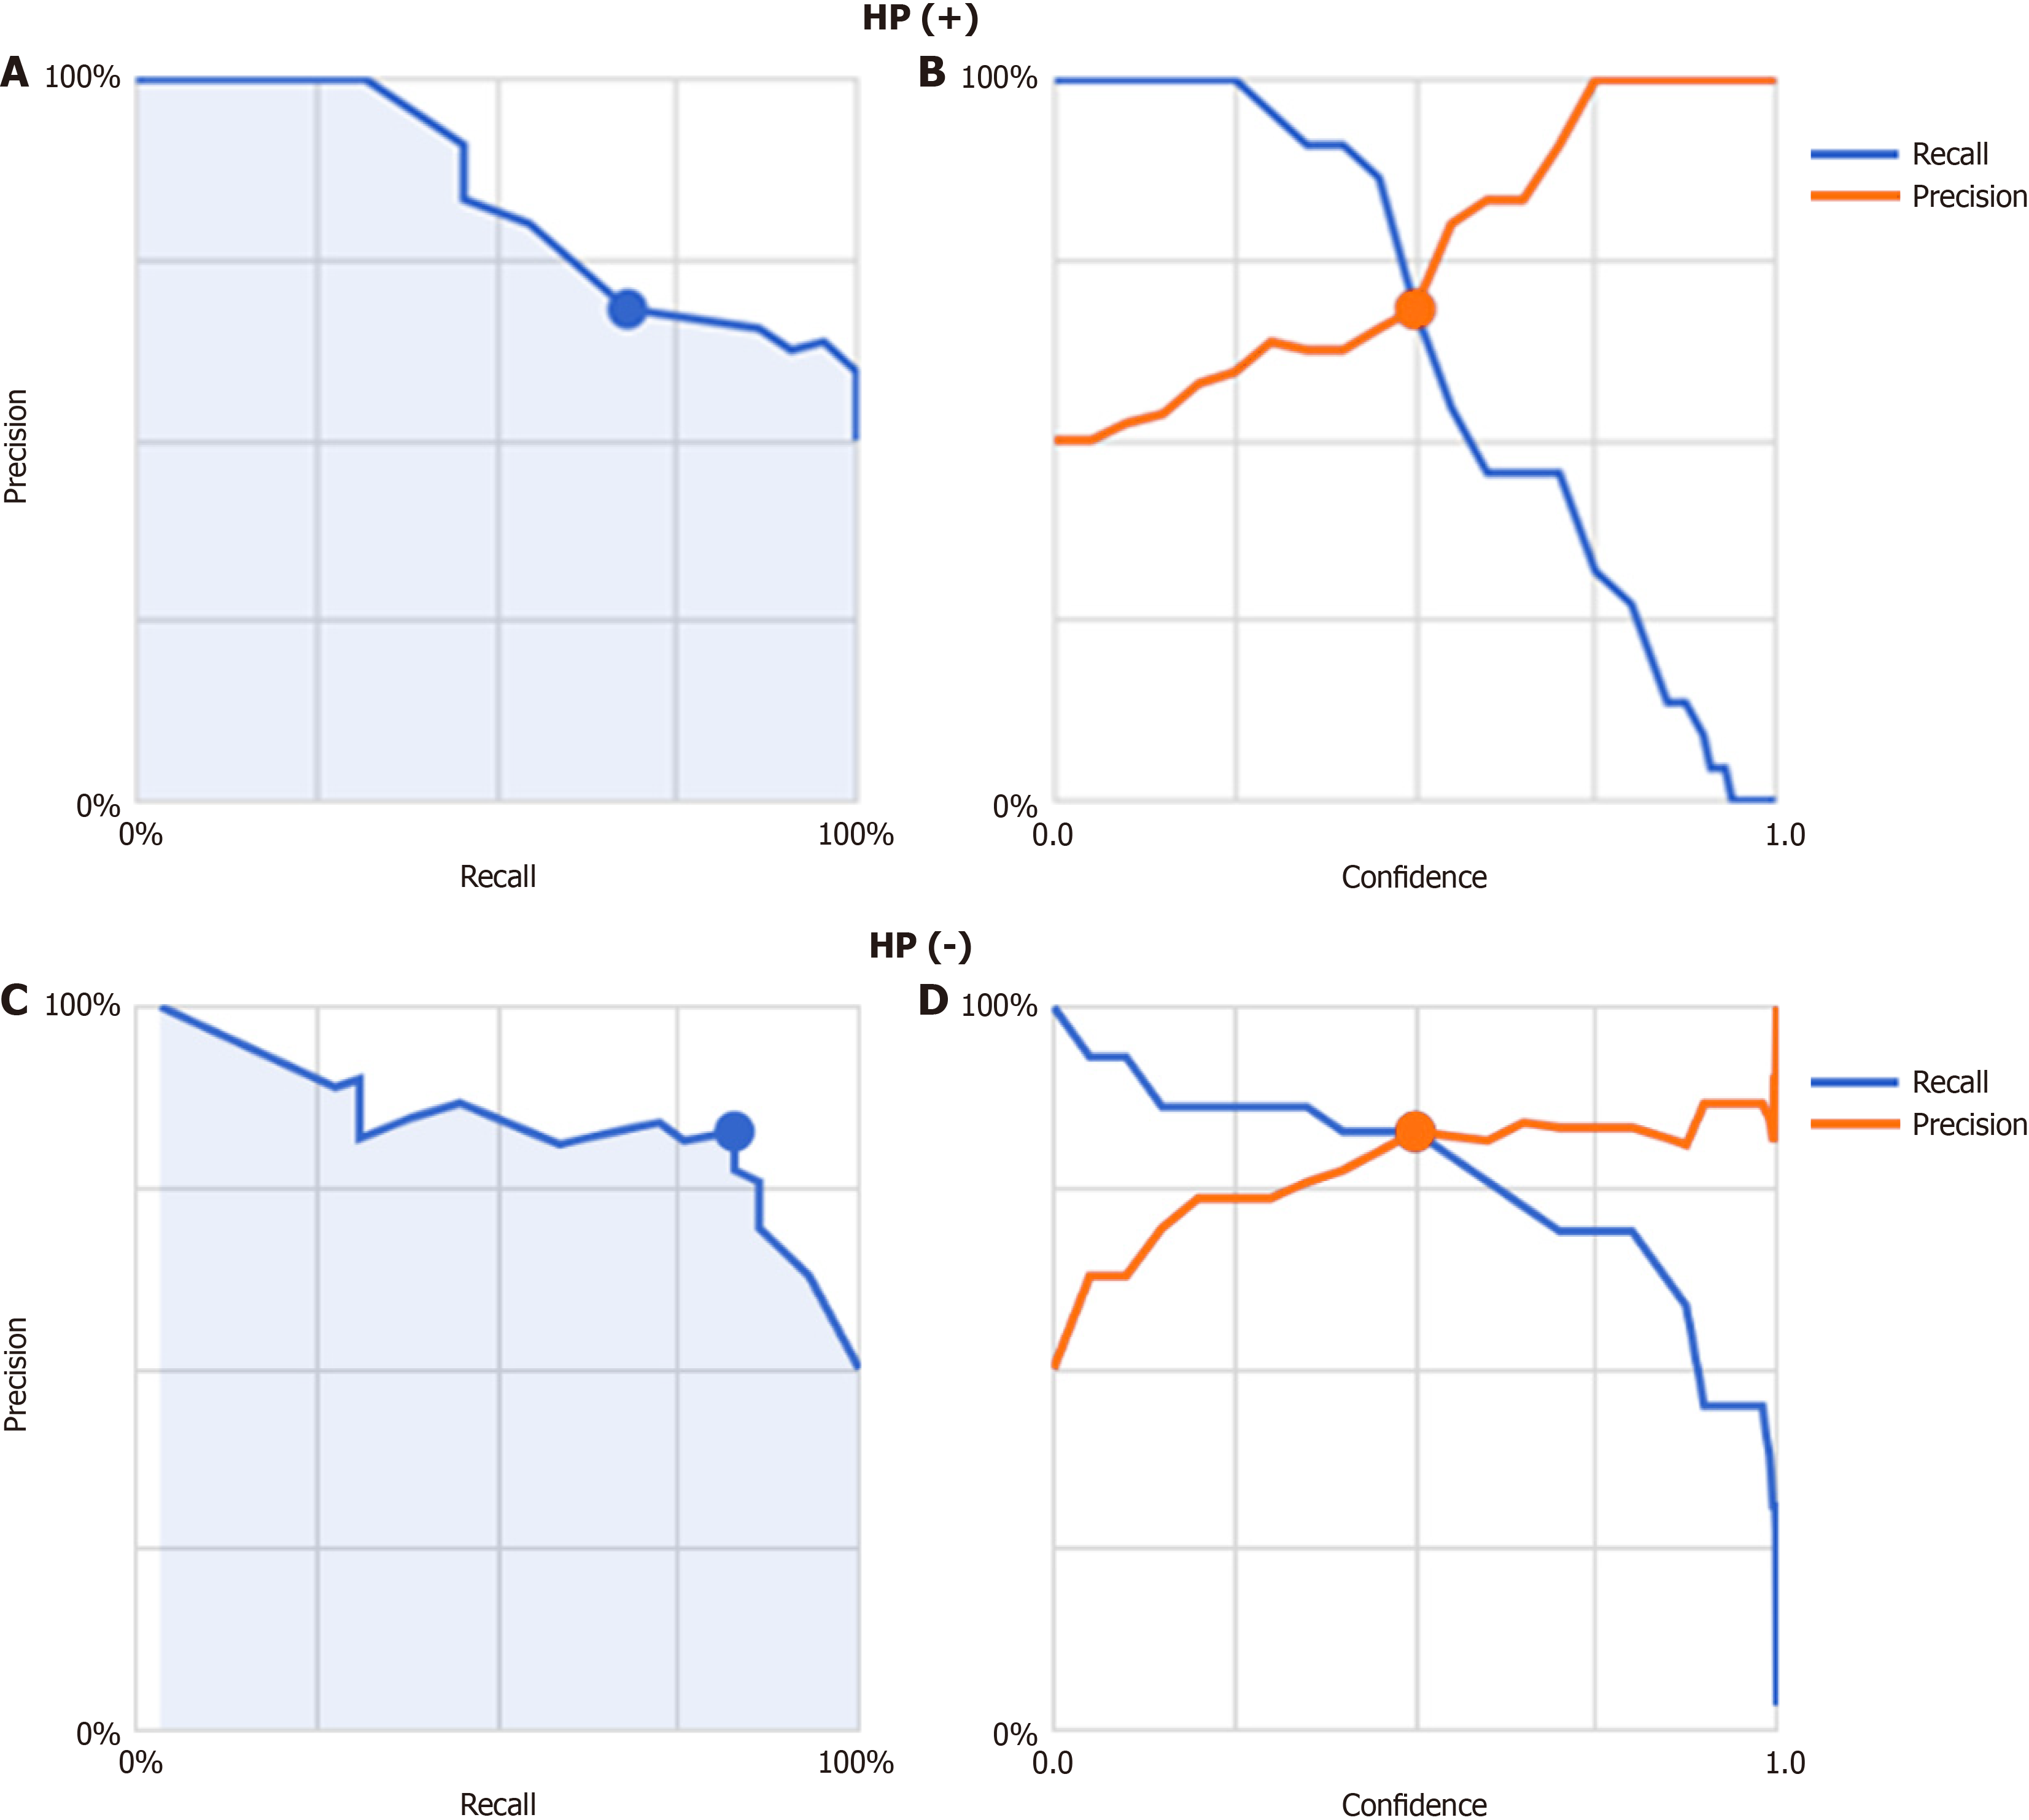
Figure 2 Two artificial intelligence models were constructed separately for Helicobacter pylori-positive and Helicobacter pylori-negative cases.
A: The precision-recall curve for the Helicobacter pylori (HP)-positive duodenal image artificial intelligence (AI) model; B: The precision and recall by threshold plot for the HP-positive duodenal image AI model; C: The precision-recall curve for the HP-negative duodenal image AI model; D: The Precision and Recall by Threshold plot for the HP-negative duodenal image AI model. HP: Helicobacter pylori.
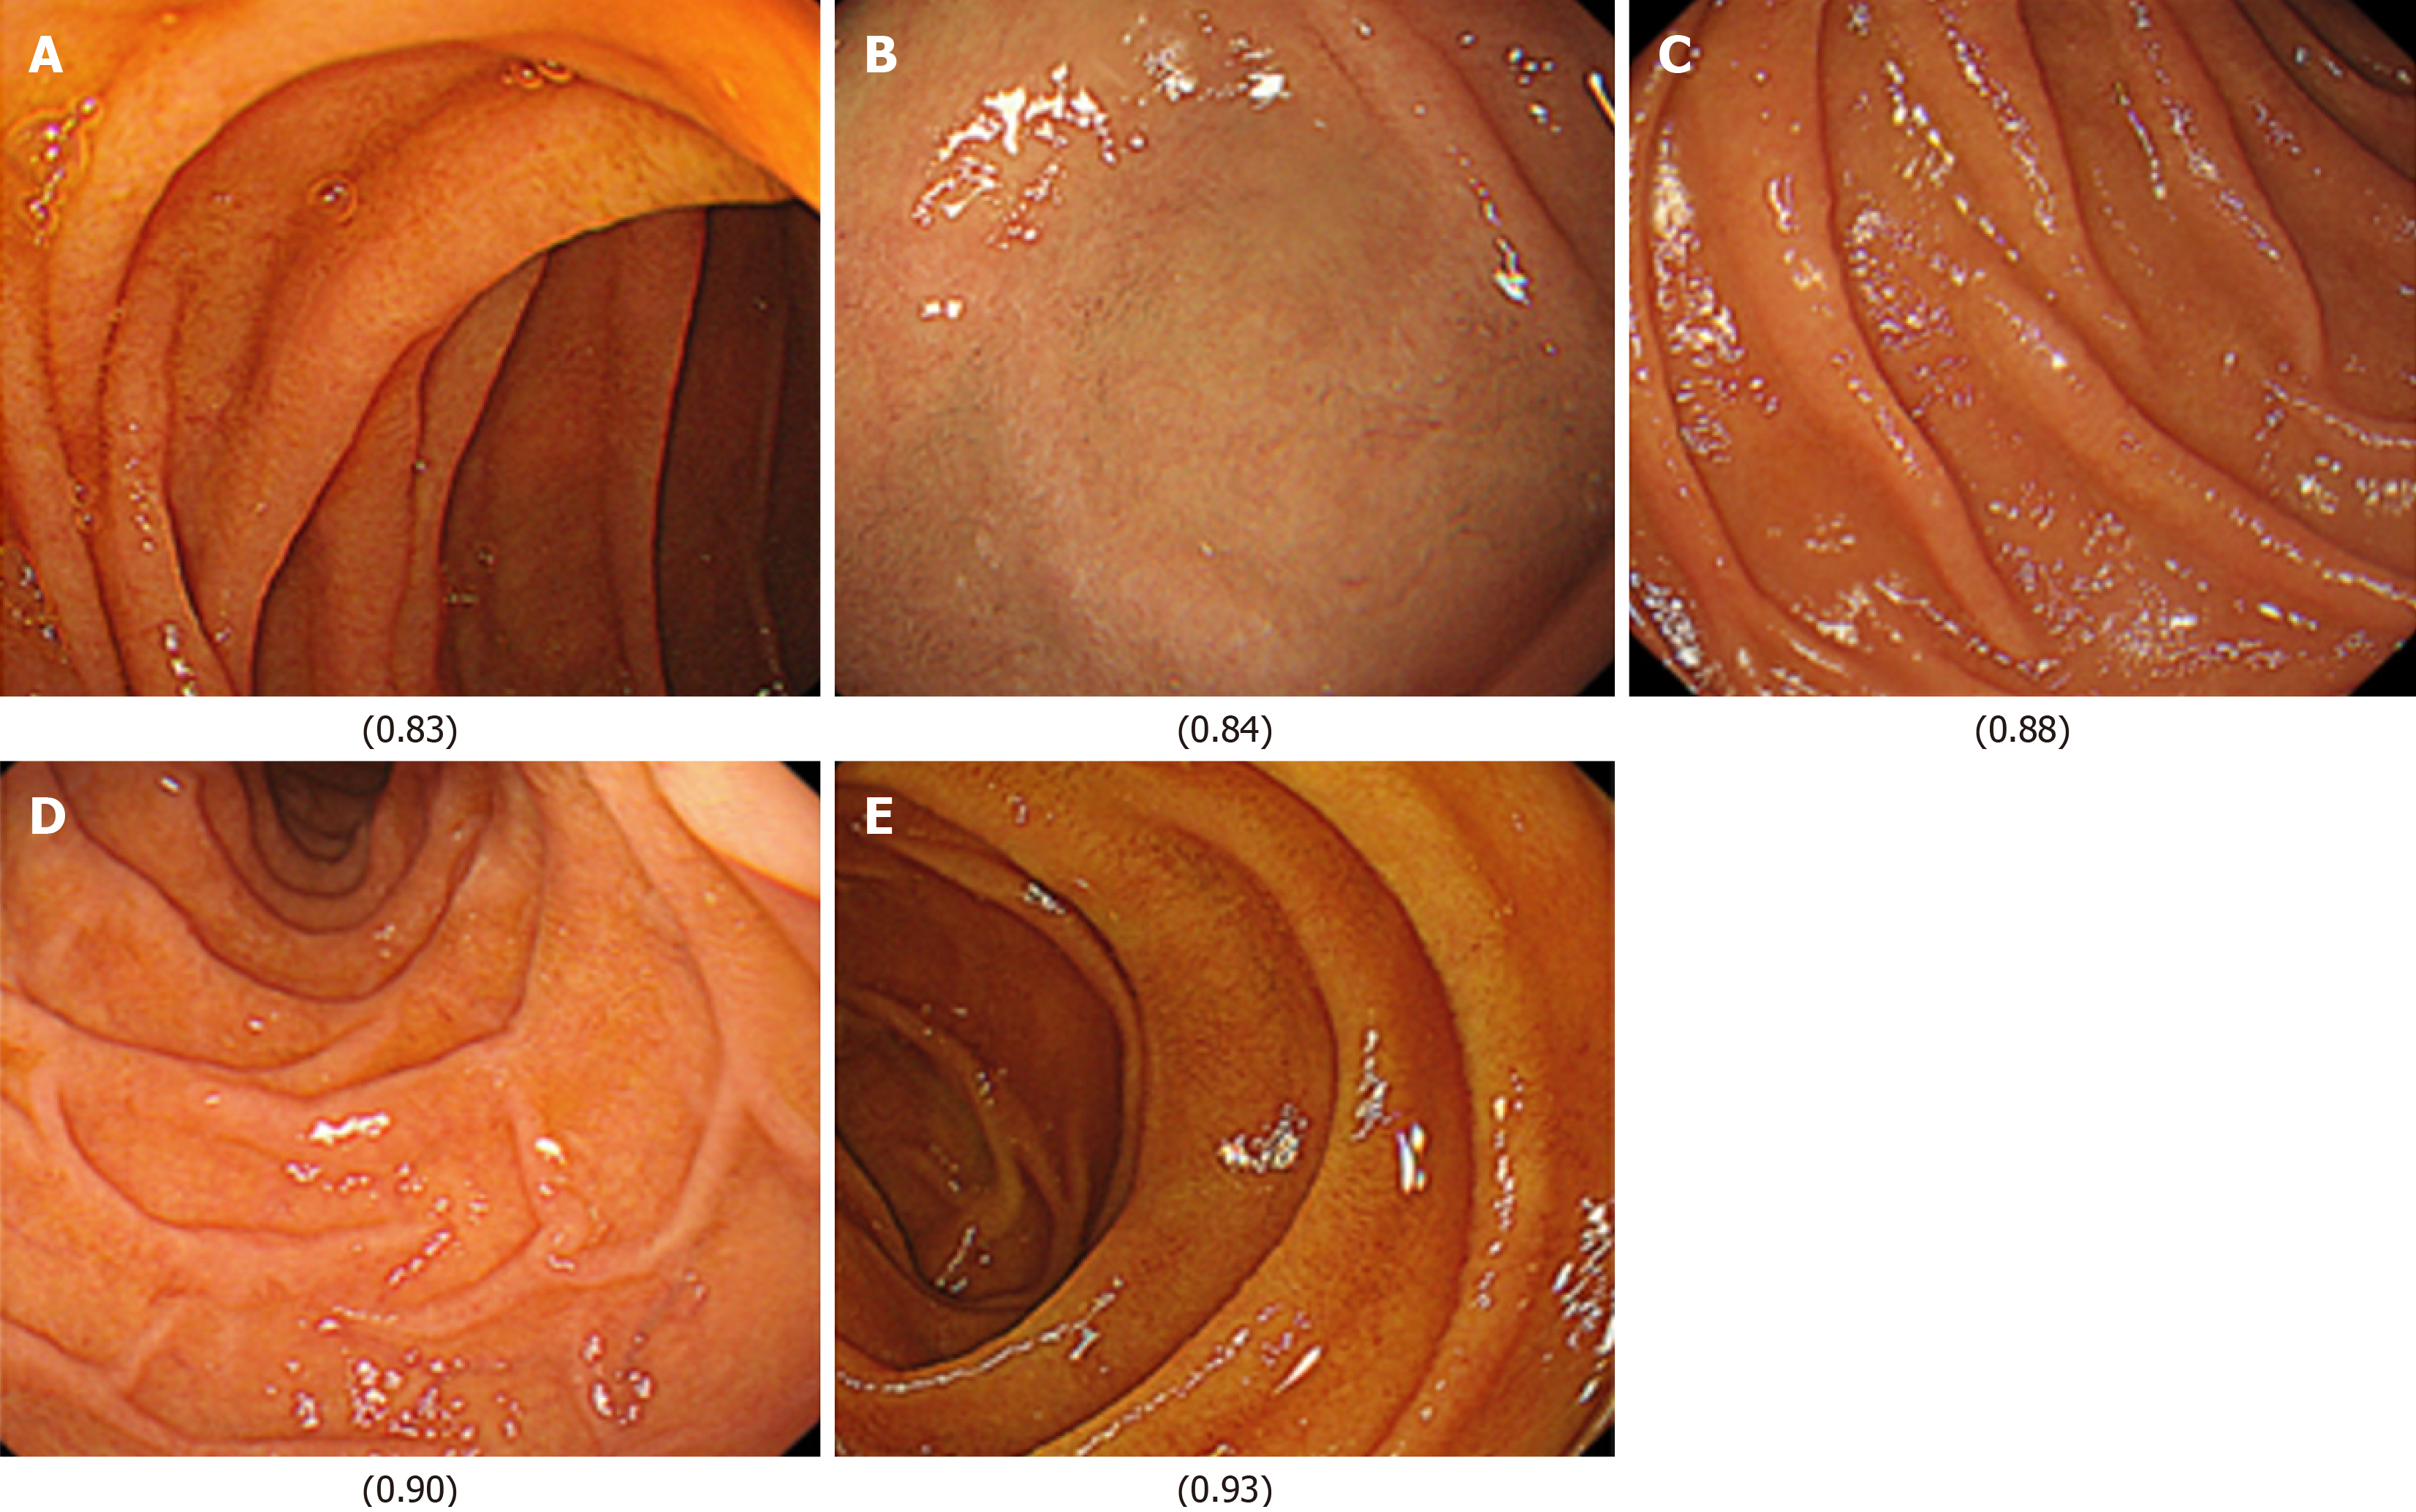
Figure 3 Representative duodenal images evaluated by the artificial intelligence model for detecting the absence of functional dyspepsia in Helicobacter pylori-infected patients.
The values shown correspond to the model's confidence score (ranging from 0 to 1). A: A duodenal image with a high artificial intelligence (AI) confidence score of 0.83, indicating a strong prediction of the absence of functional dyspepsia; B: A duodenal image with the highest AI confidence score of 0.84; C: A duodenal image with a score of 0.88; D: A duodenal image with a score of 0.90; E: A duodenal image with a score of 0.93.
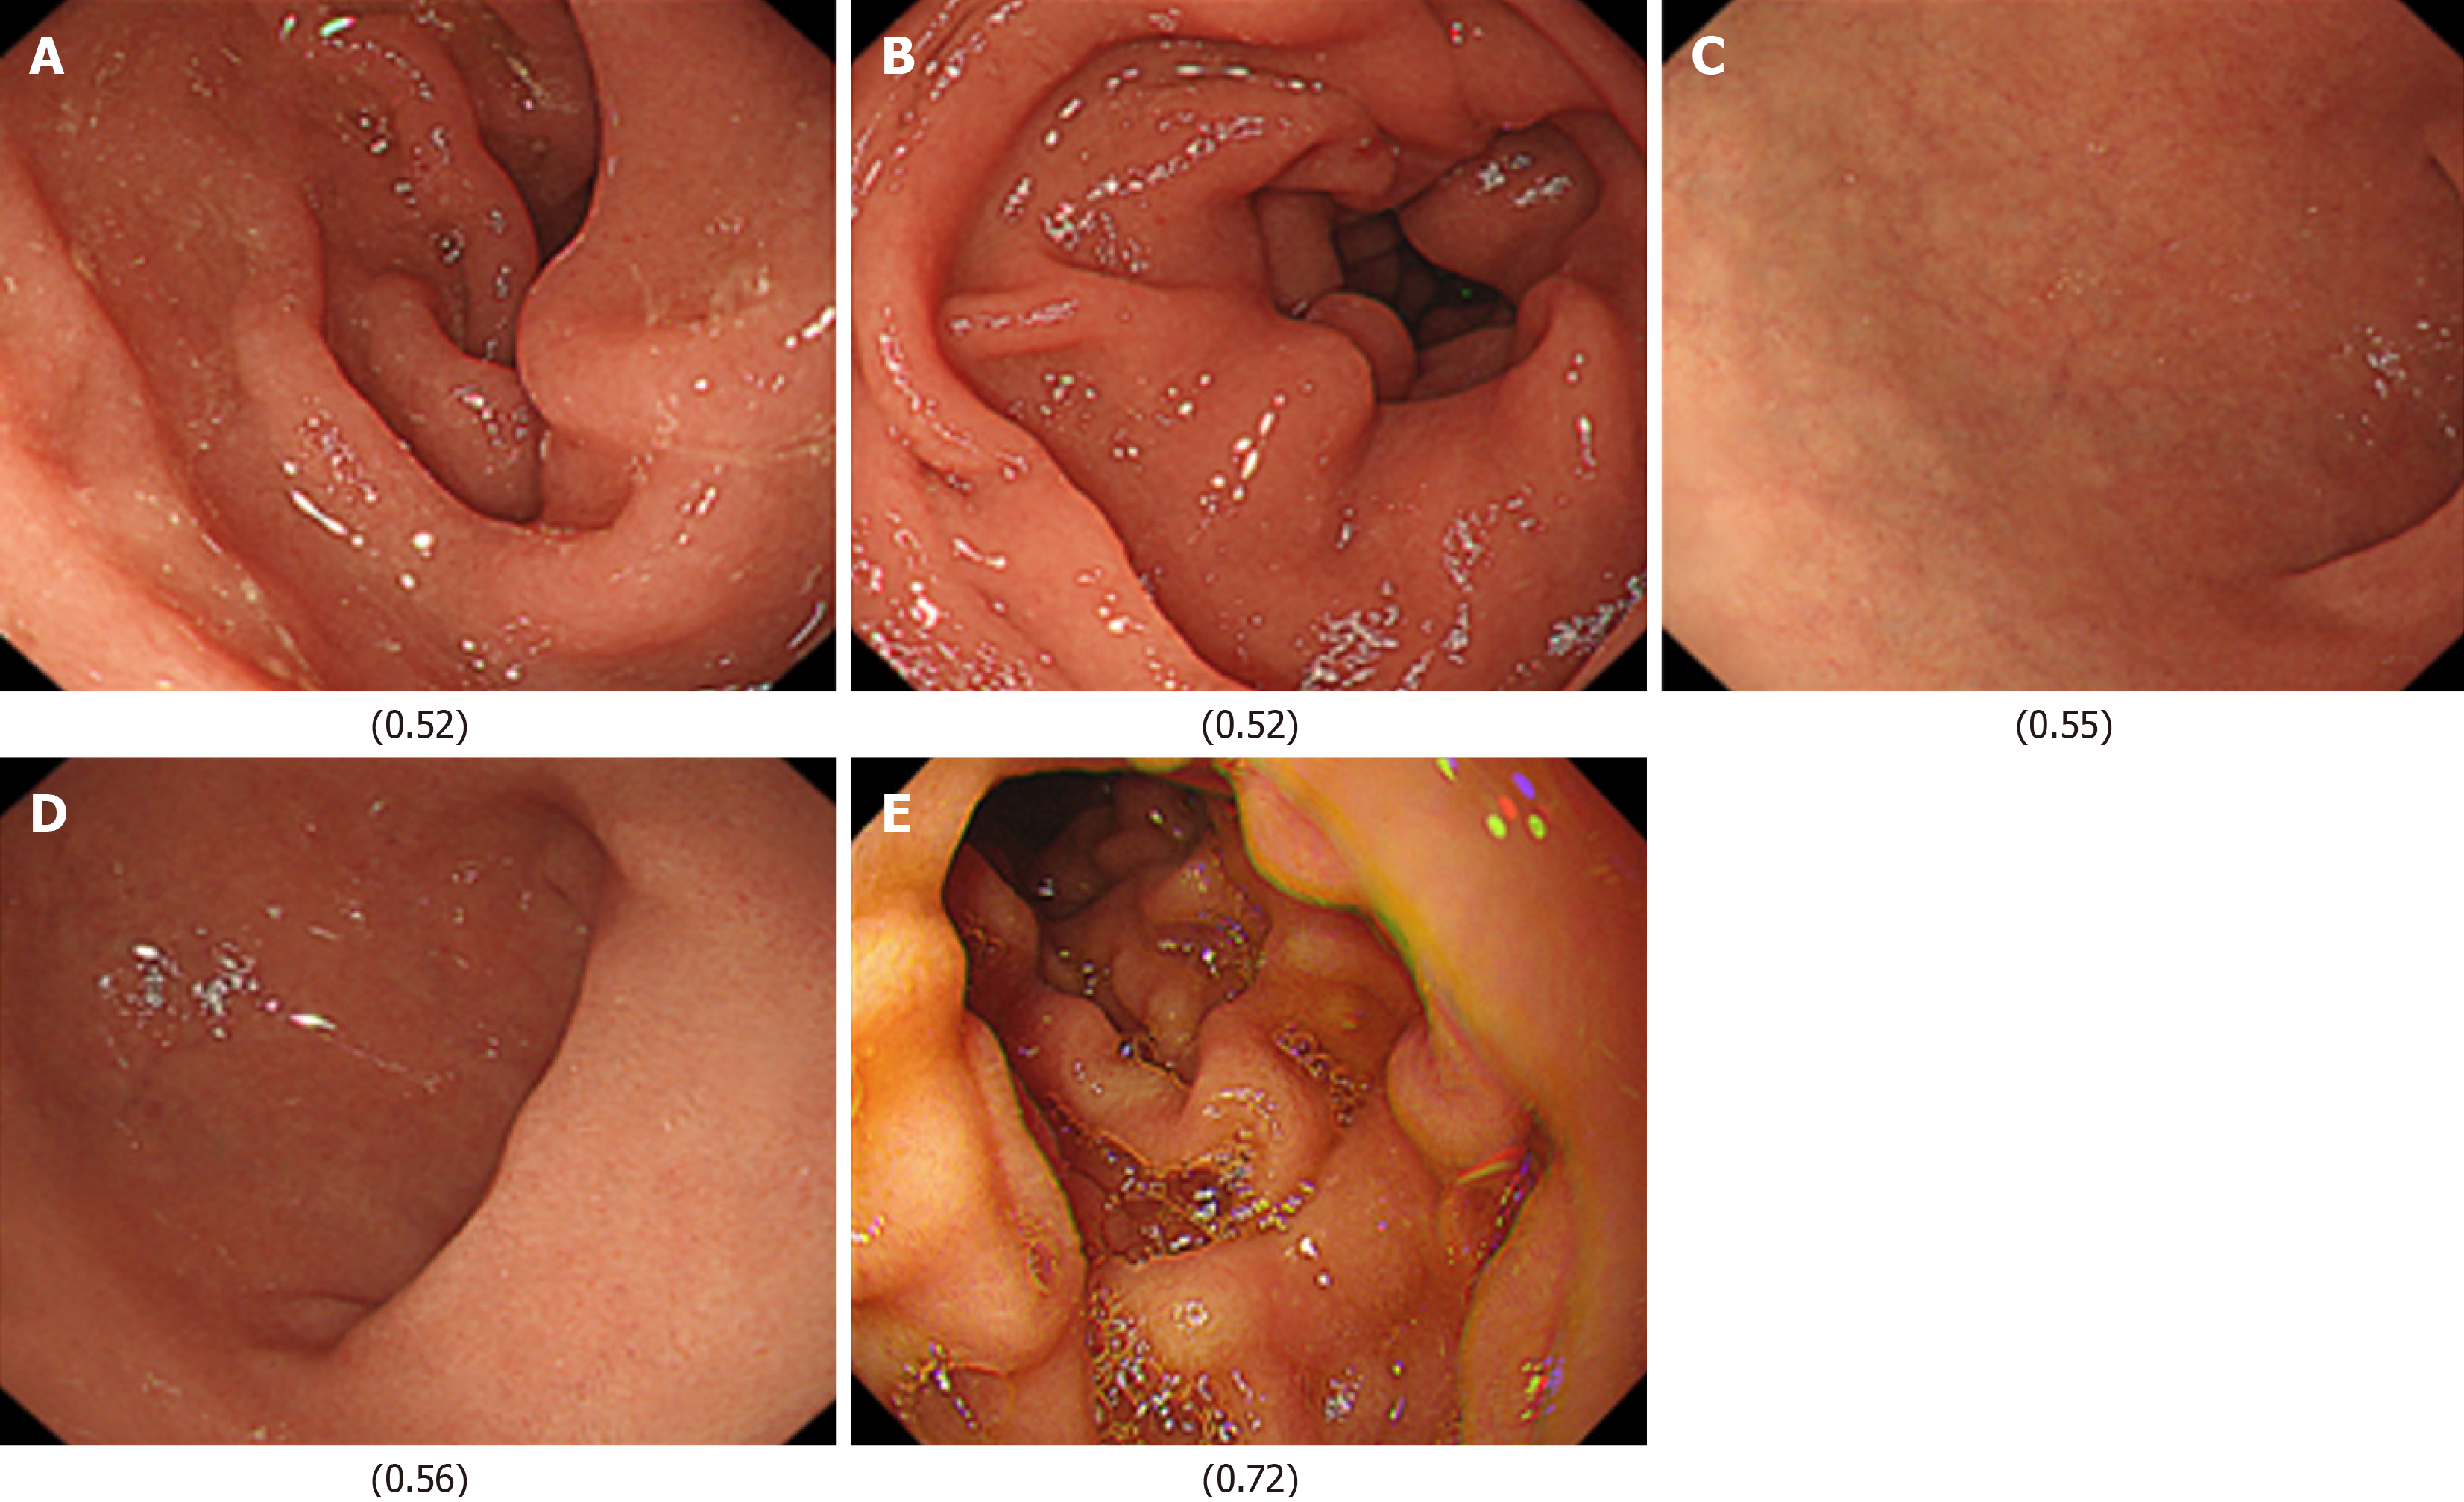
Figure 4 Representative duodenal images evaluated by the artificial intelligence model for detecting the presence of functional dyspepsia in Helicobacter pylori-infected patients.
The values shown correspond to the model's confidence score (ranging from 0 to 1). A: A duodenal image with an artificial intelligence confidence score of 0.52; B: A duodenal image with a score of 0.52; C: A duodenal image with a score of 0.55; D: A duodenal image with a score of 0.56; E: A duodenal image with a score of 0.72.
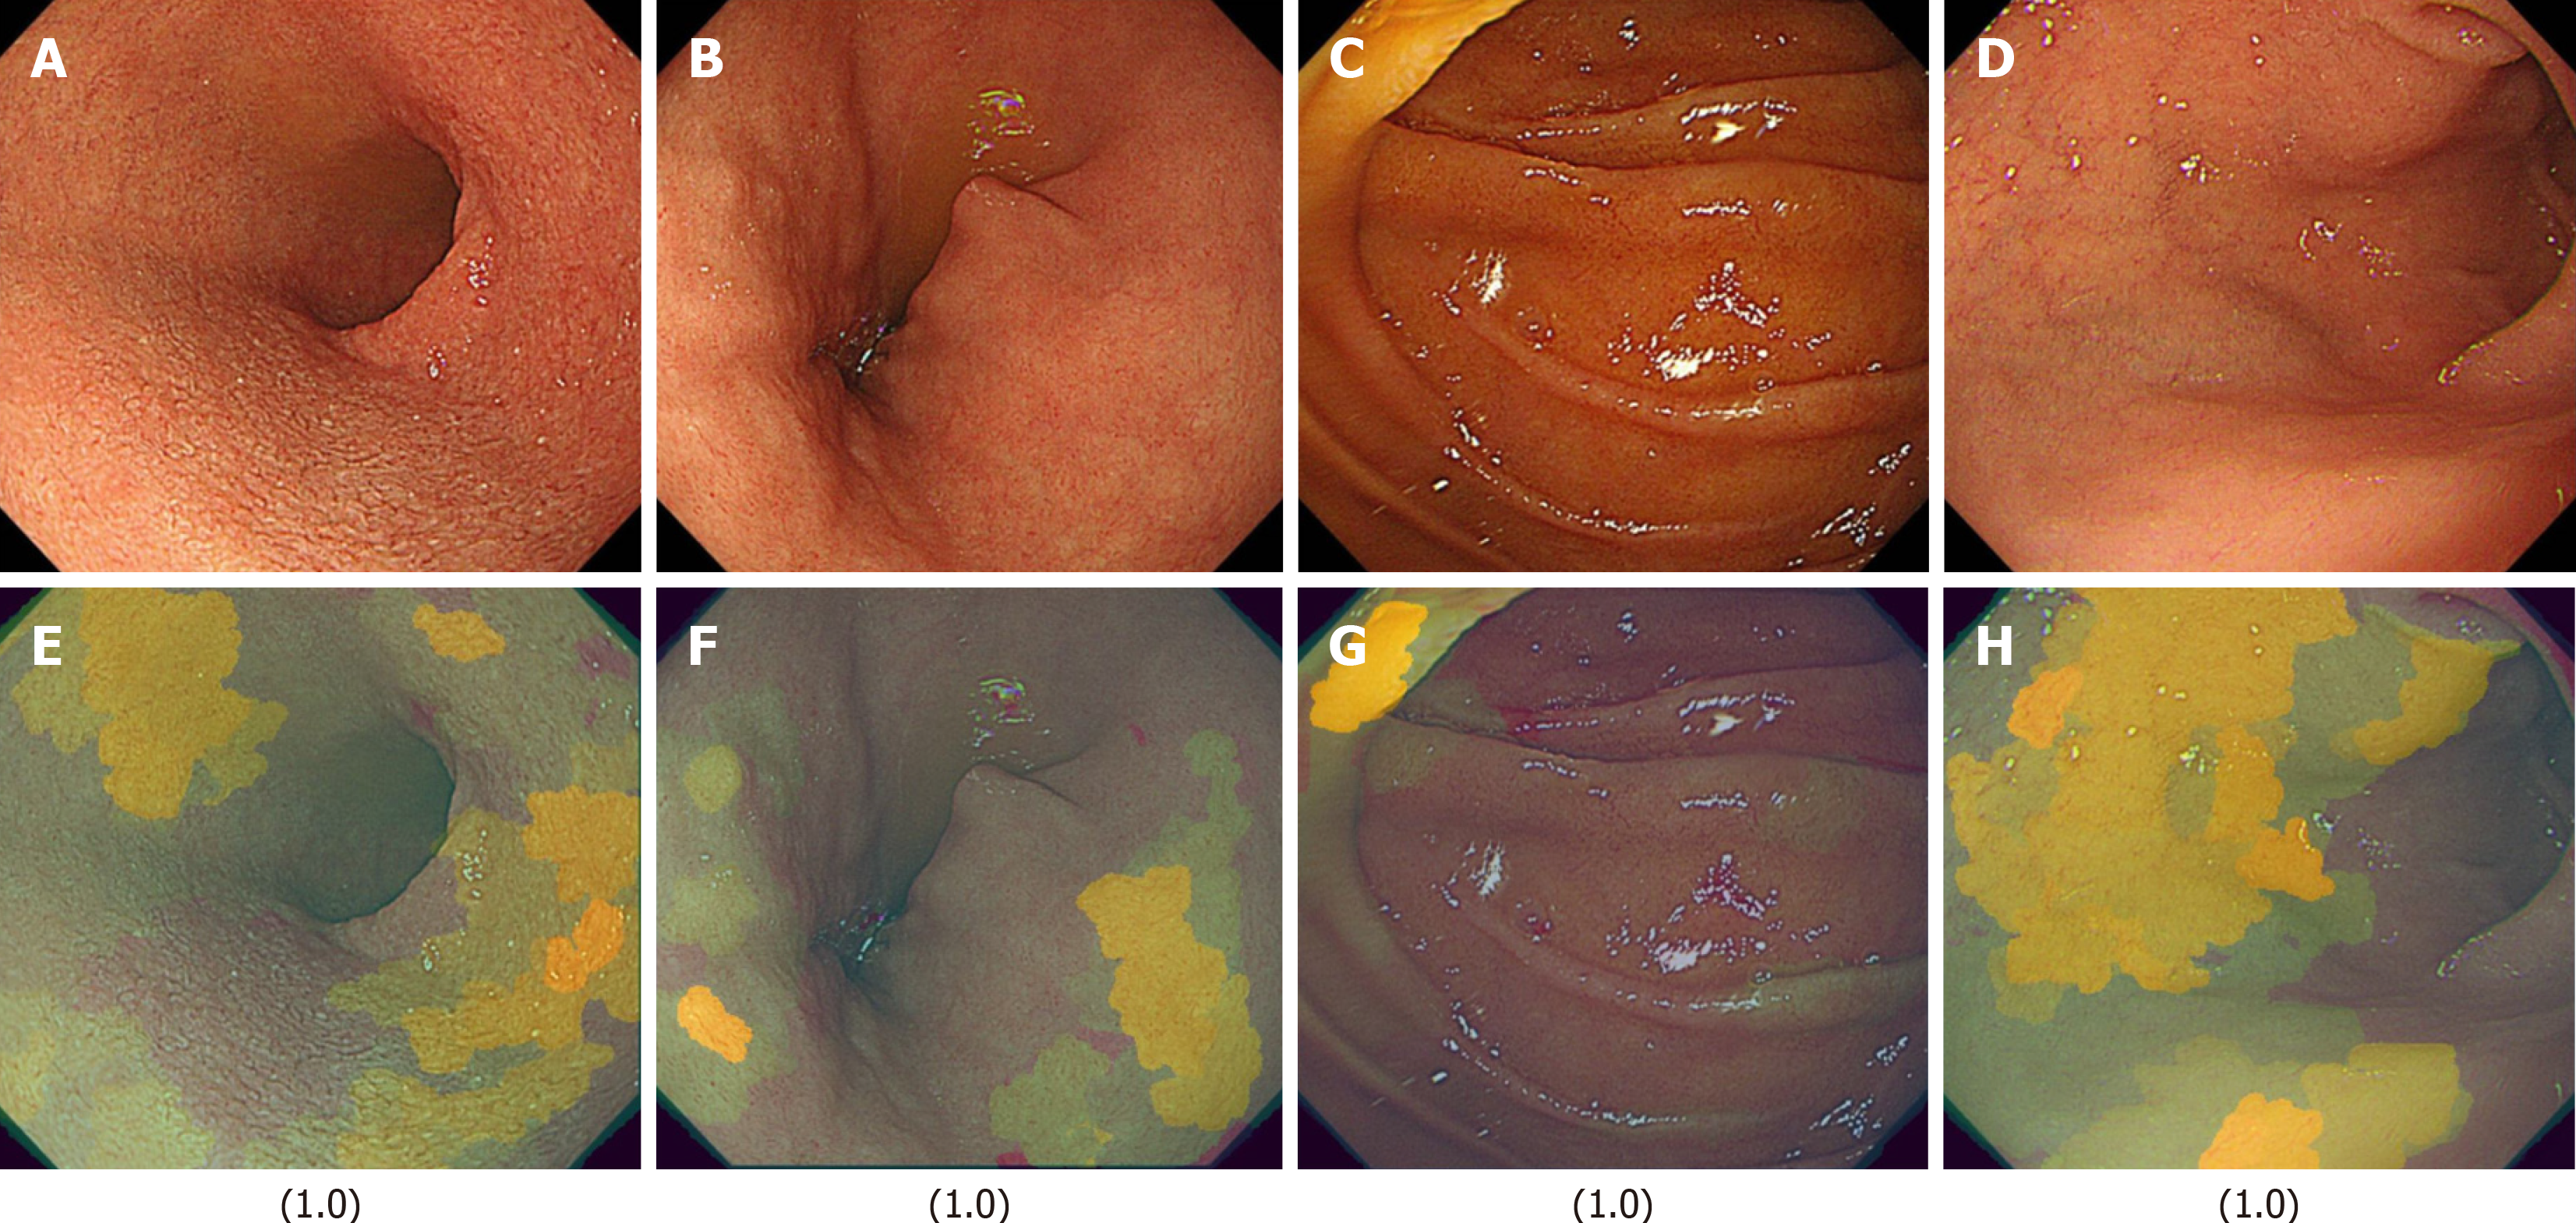
Figure 5 Representative light images and their corresponding XAI (XRAI) images with high confidence scores (1.
0) in the duodenal image artificial intelligence model for detecting the absence of functional dyspepsia in Helicobacter pylori-infected patients. The values displayed correspond to the assigned scores. A: A light image of the duodenal mucosa with a confidence score of 1.0, indicating a strong prediction of the absence of functional dyspepsia; B: Another light image with a score of 1.0; C: A light image with a confidence score of 1.0; D: A light image with a confidence score of 1.0; E: The XAI (XRAI) visualization corresponding to A, highlighting the regions the artificial intelligence model considered important for its classification; F: The XAI (XRAI) visualization corresponding to B; G: The XAI (XRAI) visualization corresponding to C; H: The XAI (XRAI) visualization corresponding to D.
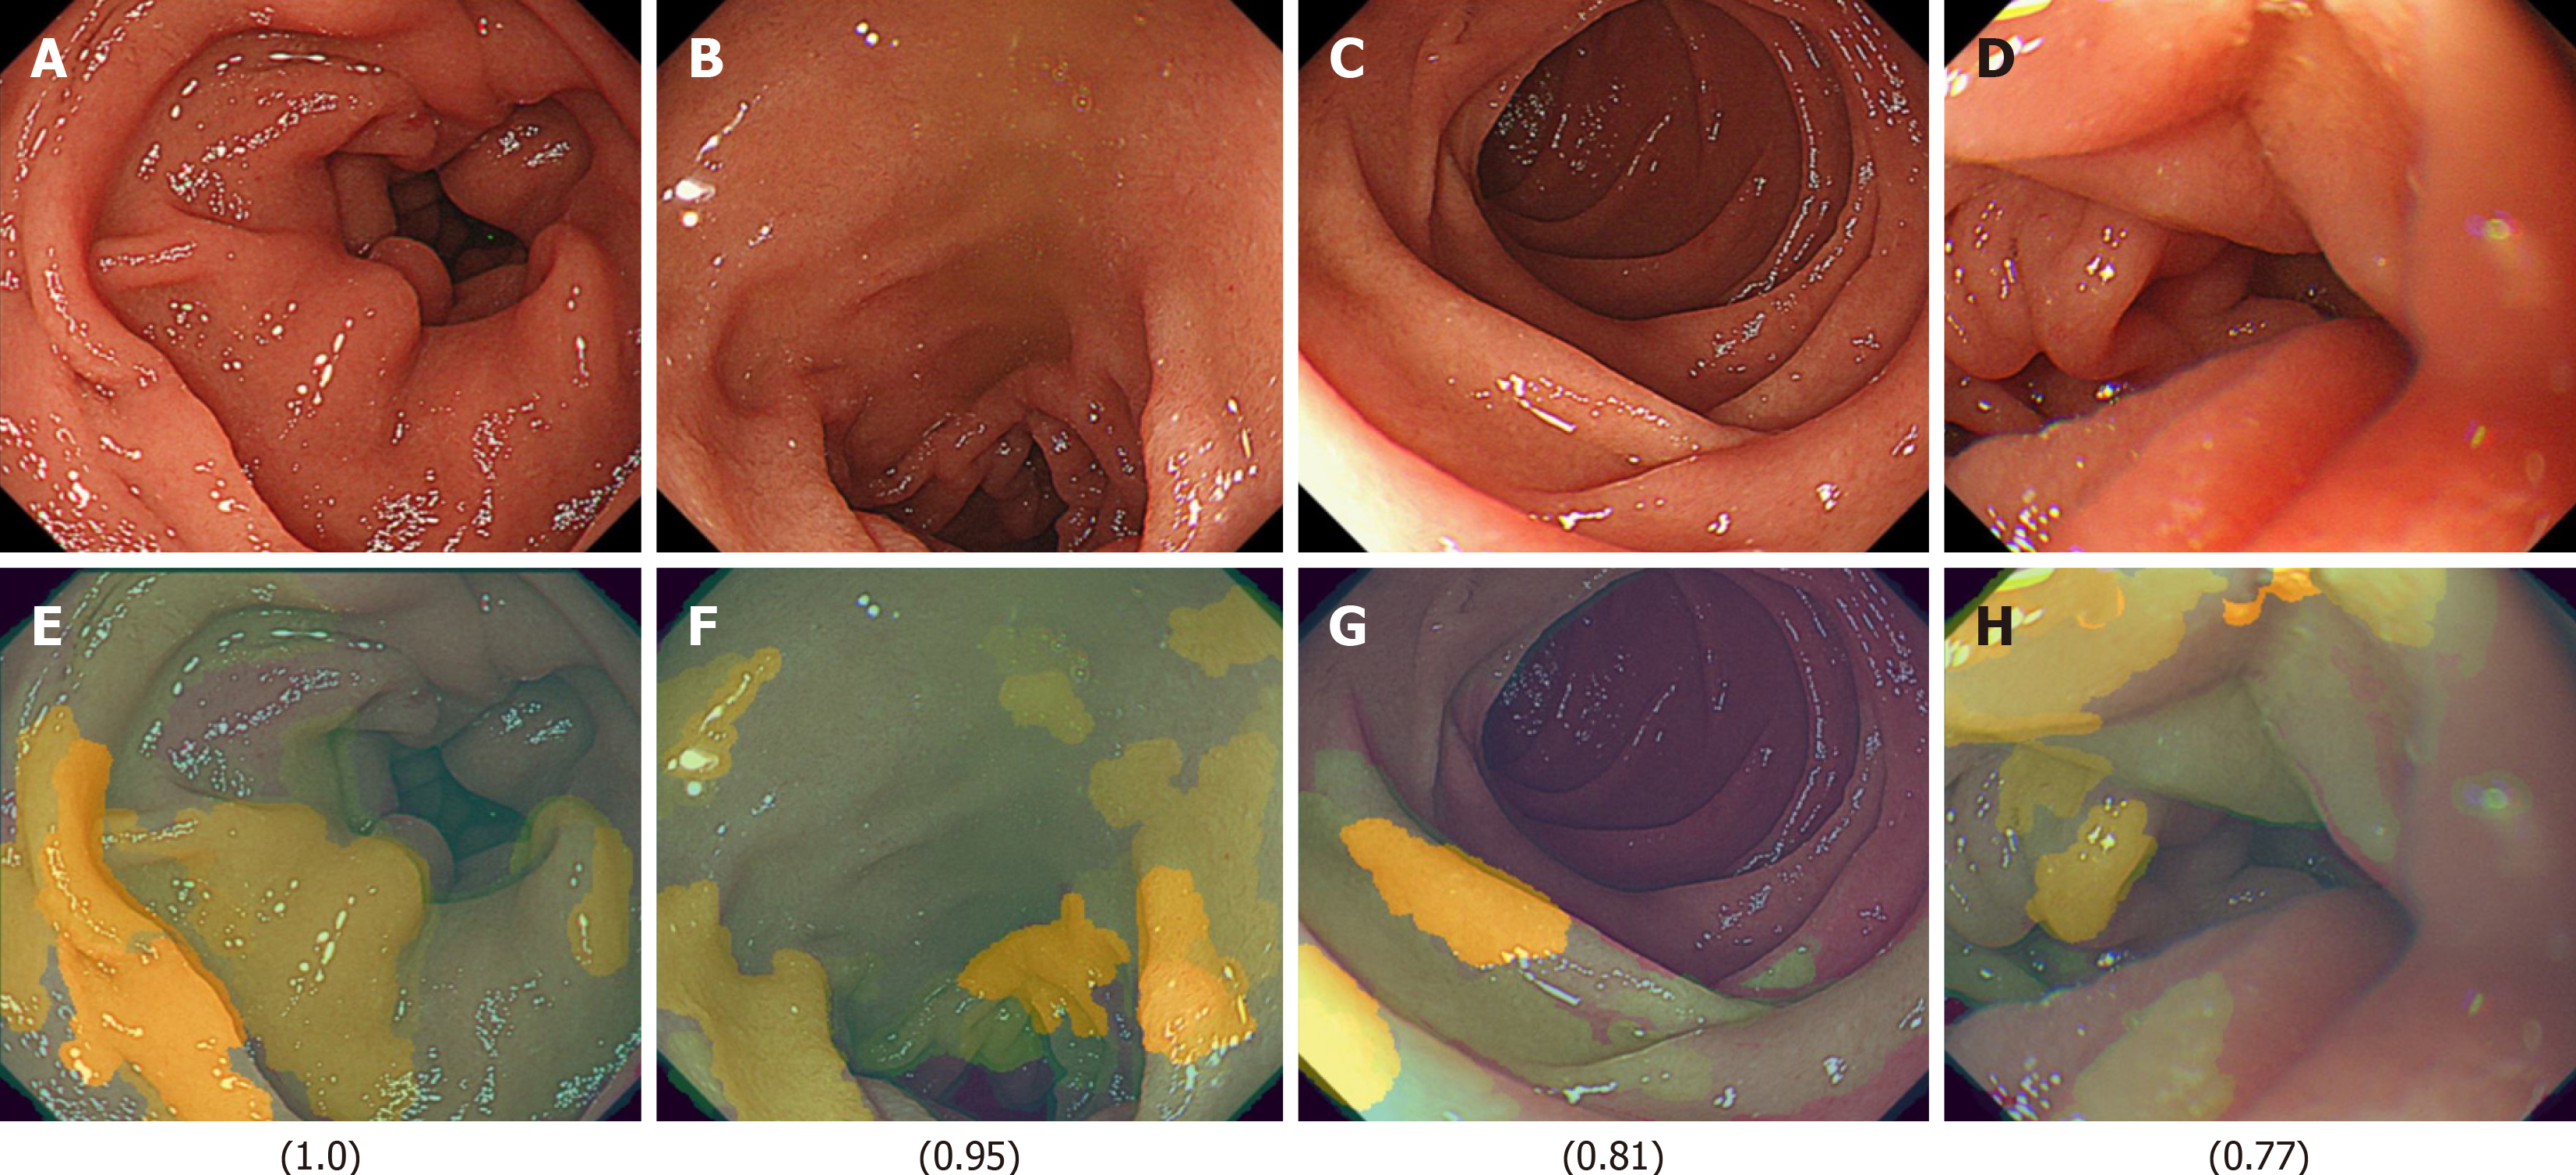
Figure 6 Representative light images and their corresponding XAI (XRAI) images with high confidence scores (ranging from 0 to 1) in the duodenal image artificial intelligence model for detecting the presence of functional dyspepsia in Helicobacter pylori-infected patients.
The values displayed correspond to the assigned scores. A: A light image of the duodenal mucosa with a high artificial intelligence (AI) confidence score of 1.0, indicating a strong prediction of functional dyspepsia; B: Another light image with a high AI confidence score of 0.95; C: A light image with a score of 0.81; D: A light image with a score of 0.77; E: The XAI (XRAI) visualization corresponding to A, highlighting the regions the AI model identified as most influential in its prediction; F: The XAI (XRAI) visualization corresponding to B; G: The XAI (XRAI) visualization corresponding to C; H: The XAI (XRAI) visualization corresponding to D.
- Citation: Mihara H, Nanjo S, Motoo I, Ando T, Fujinami H, Yasuda I. Artificial intelligence model on images of functional dyspepsia. Artif Intell Gastrointest Endosc 2025; 6(1): 105674
- URL: https://www.wjgnet.com/2689-7164/full/v6/i1/105674.htm
- DOI: https://dx.doi.org/10.37126/aige.v6.i1.105674


