
















Copyright: ©Author(s) 2026.
Artif Intell Cancer. Sep 8, 2026; 7(1): 116460
Published online Sep 8, 2026. doi: 10.35713/aic.v7.i1.116460
Published online Sep 8, 2026. doi: 10.35713/aic.v7.i1.116460
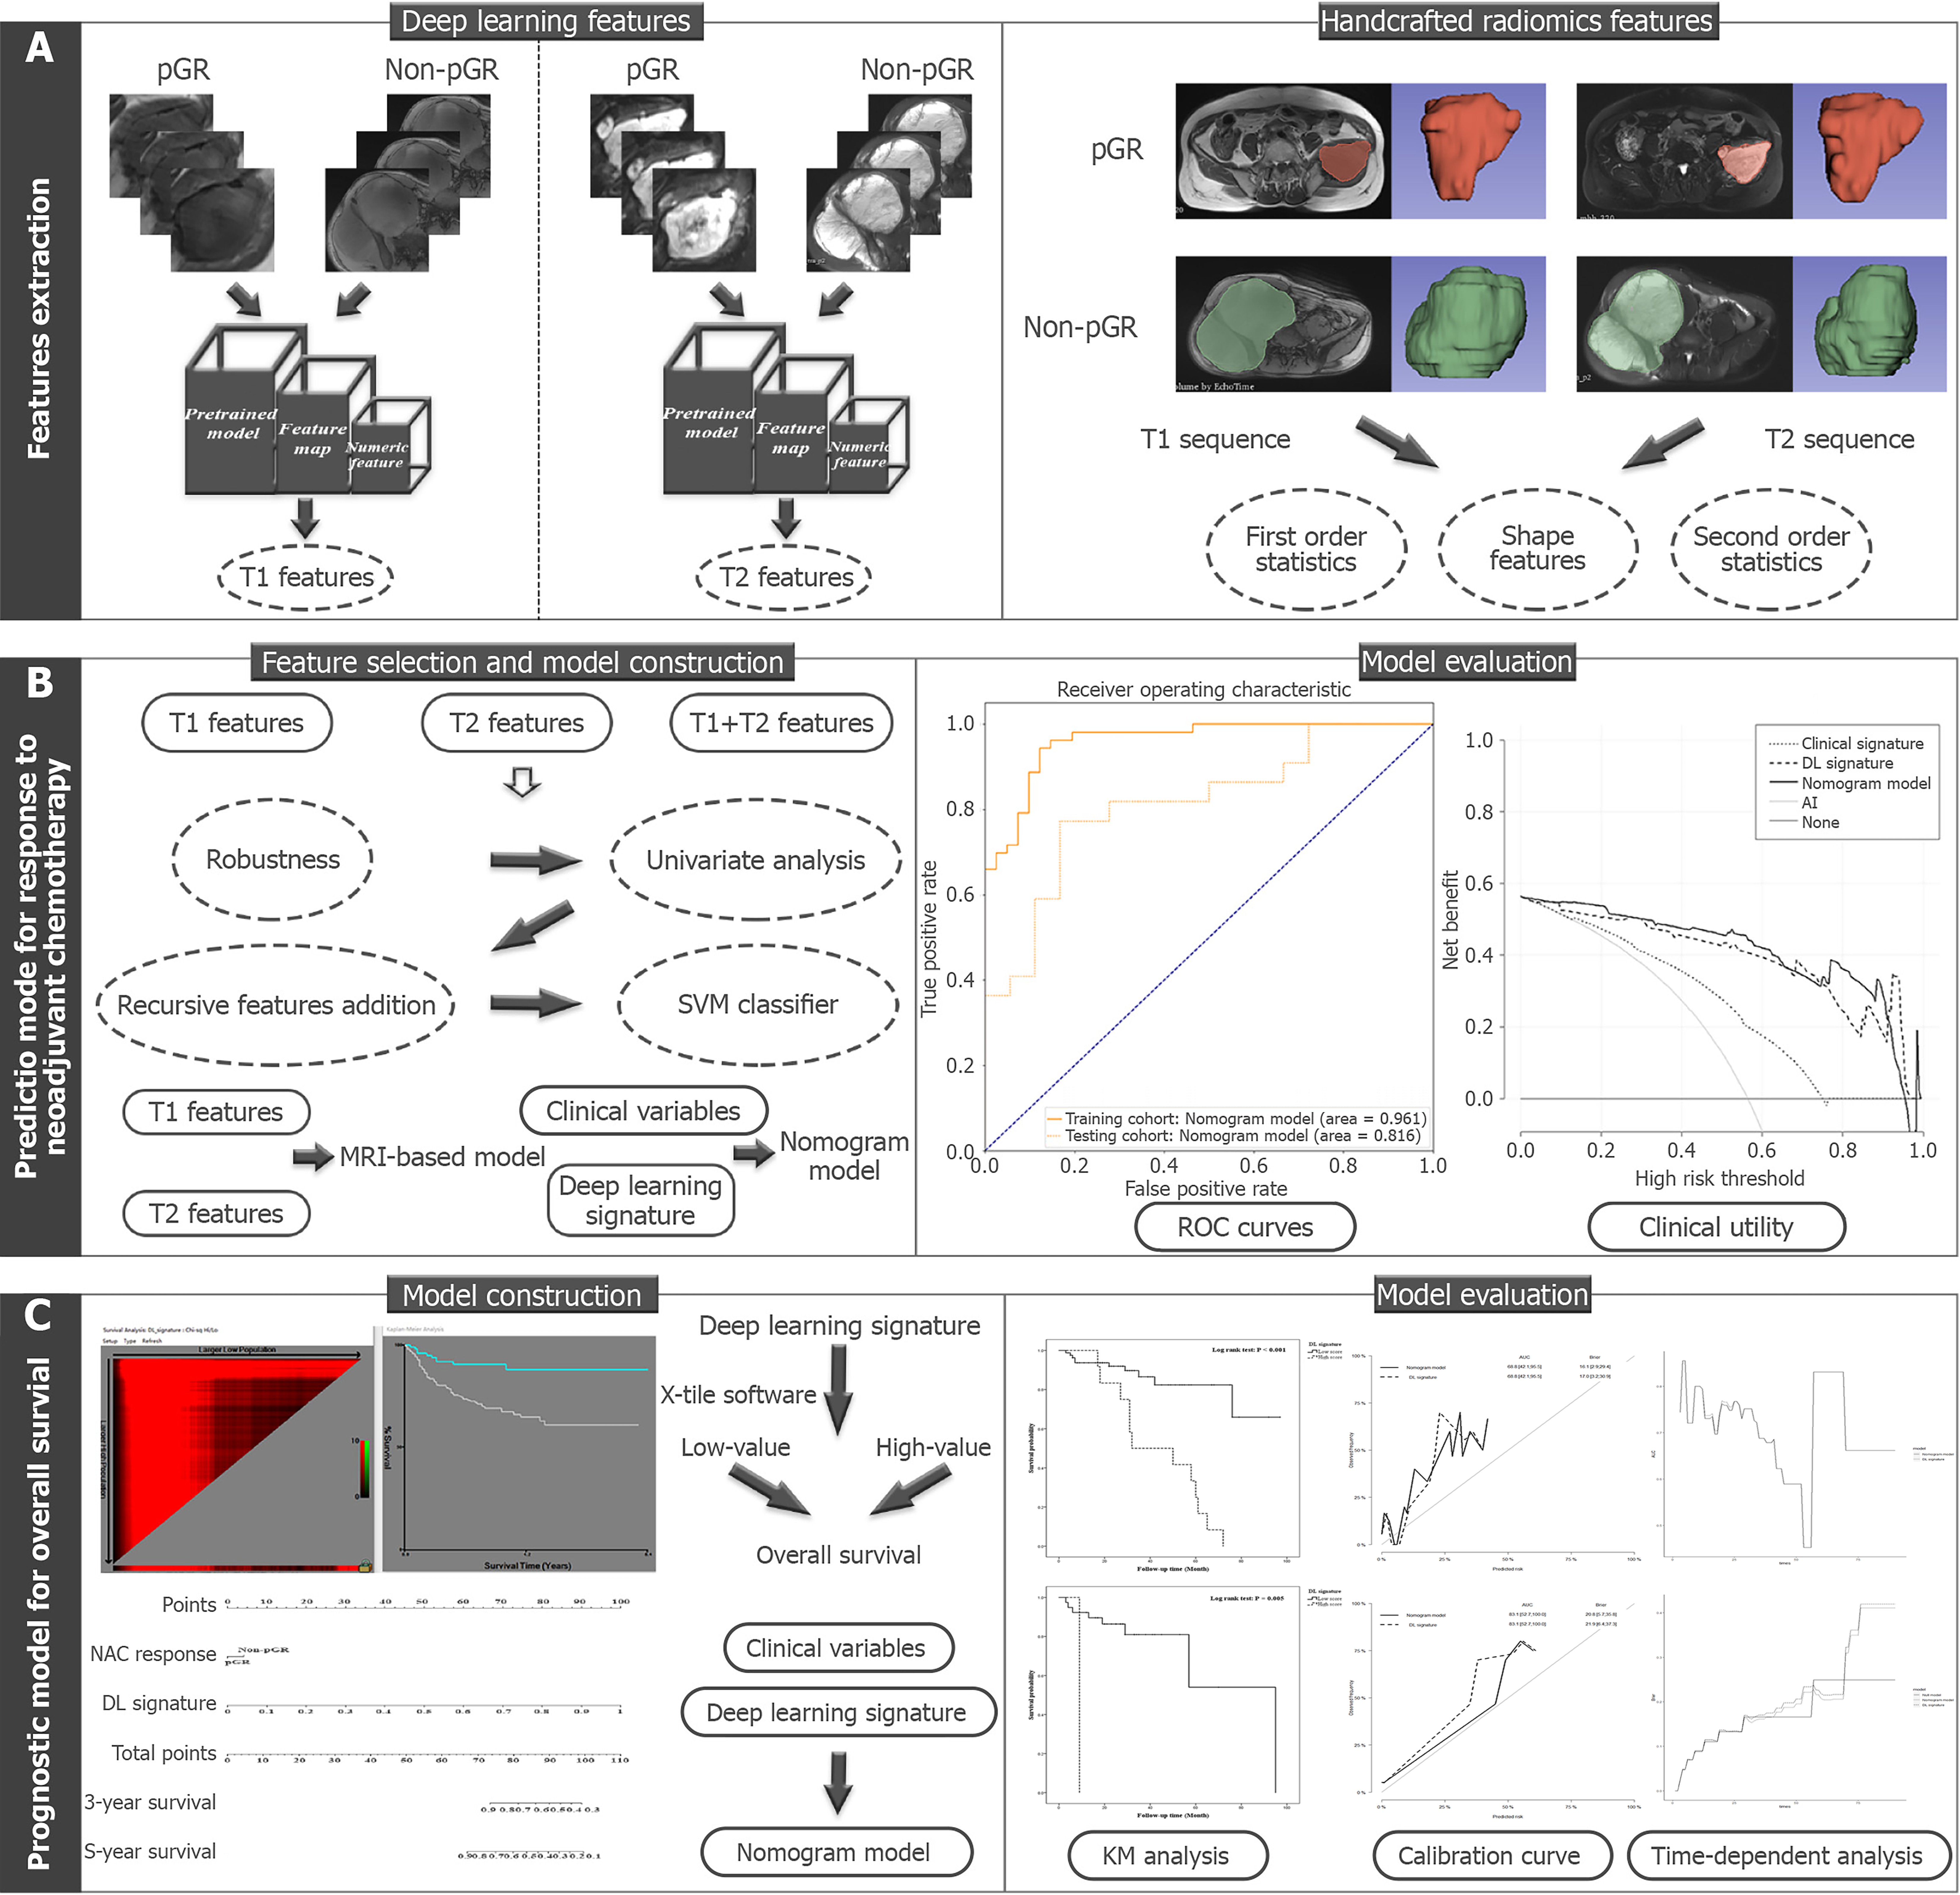
Figure 1 A general flowchart of data analysis in prediction of response to neoadjuvant chemotherapy and survival outcome for adolescents and young adults with osteosarcoma.
A: Features extraction: Imaging-derived features on T1- and T2- magnetic resonance imaging sequences were extracted by the deep learning (DL) analysis and handcrafted radiomics analysis, respectively; B: Prediction model construction and evaluation for response to neoadjuvant chemotherapy: The prediction models in identification of response to neoadjuvant chemotherapy were approached by machine learning methods via feature selection and model construction. The integrated nomogram model integrating clinical predictors and the DL-based signature was constructed to improve prediction performance. All prediction models were evaluated by prediction performance via receiver operating characteristic curves and calibration plots; C: The prognostic models construction and evaluation for overall survival: The DL-based signature from treatment prediction was dichotomized by the optimal cut-off points in association with overall survival with X-tile software. The integrated prognostic nomogram was constructed on prognostic clinical variables and the DL-based signature, and evaluated by Kaplan-Meier analysis, calibration curves, and time-dependent receiver operating characteristic analysis and Brier score. pGR: Pathological good response; SVM: Support vector machine; MRI: Magnetic resonance imaging; ROC: Receiver operating characteristic; DL: Deep learning; NAC: Neoadjuvant chemotherapy; AUC: Area under the receiver operating characteristics curve; KM: Kaplan-Meier.
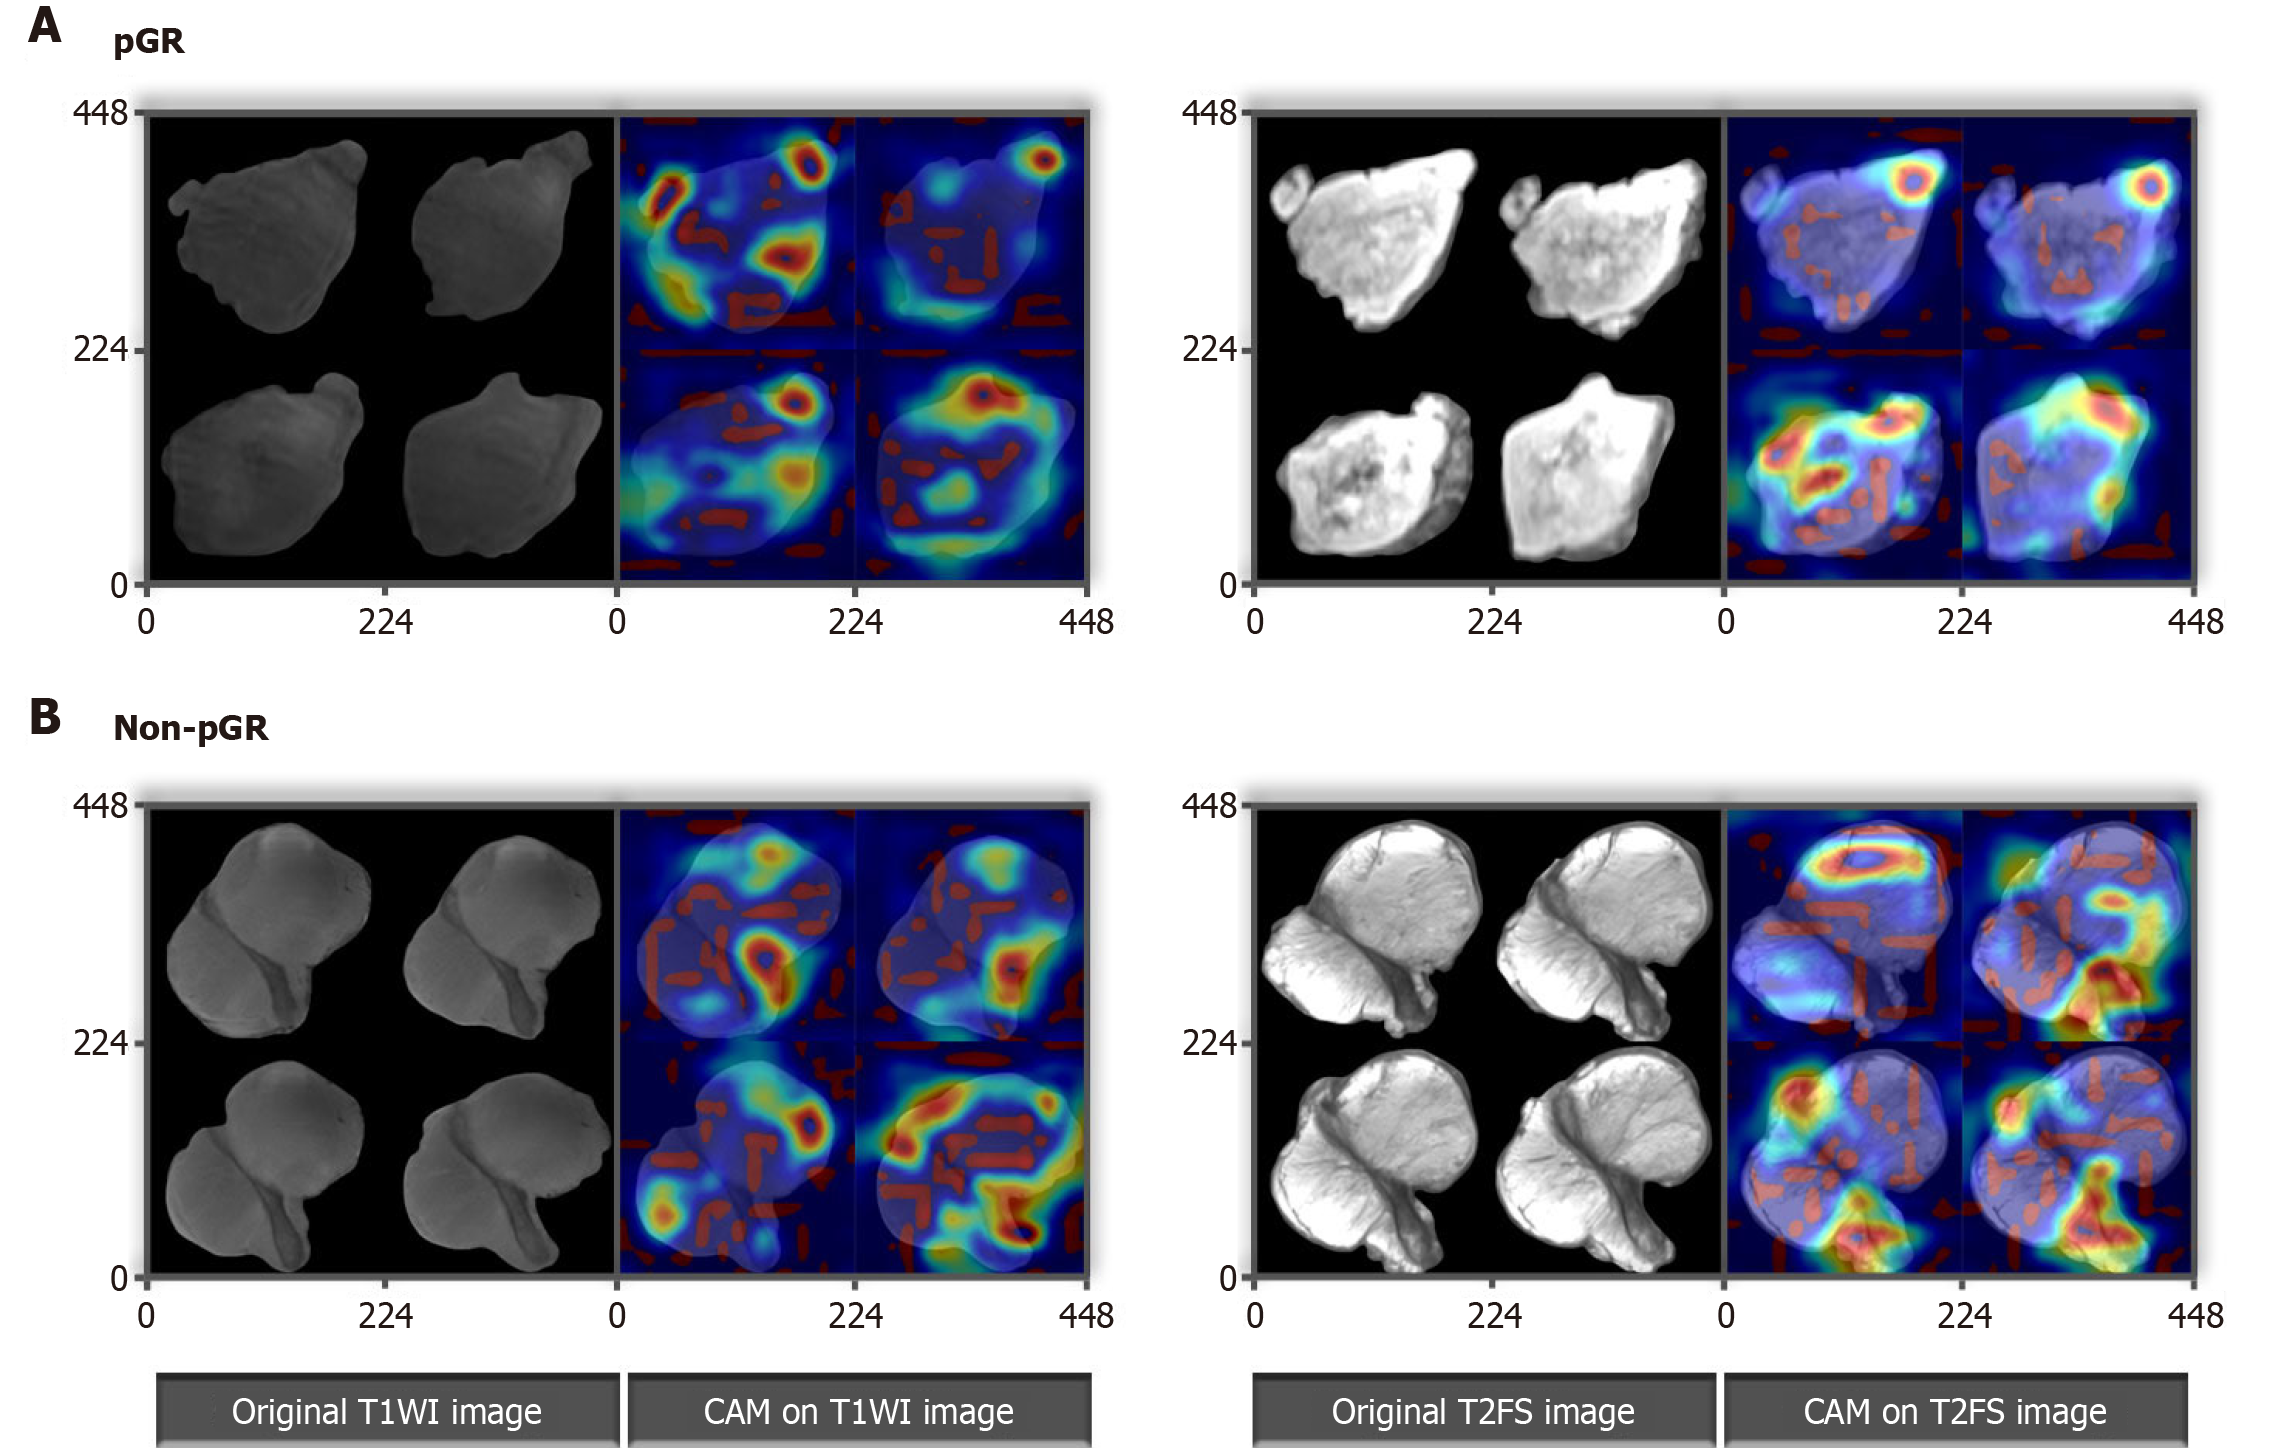
Figure 2 Feature heatmaps of representative patients on the deep learning ResNet50 algorithm via the Guided Gradient-weighted Class Activation Mapping in adolescents and young adults with osteosarcoma.
A: Pathological good response (pGR); B: Non-pGR. The original magnetic resonance imaging images and their corresponding feature heatmaps were shown from left to right. The red color highlighted the region of interest to classify pGR and non-pGR to neoadjuvant chemotherapy. The red color focused on different area for pGR (A) and non-pGR (B) on T1-weighted magnetic resonance imaging sequence (left) and fat-saturated T2-weighted magnetic resonance imaging sequence (right) magnetic resonance imaging images, respectively. The concentration of these heatmaps preferred central area for non-pGR images, and lesion boundaries for pGR images. pGR: Pathological good response; T1WI: T1-weighted magnetic resonance imaging sequence; CAM: Class activation mapping; T2FS: Fat-saturated T2-weighted magnetic resonance imaging sequence.
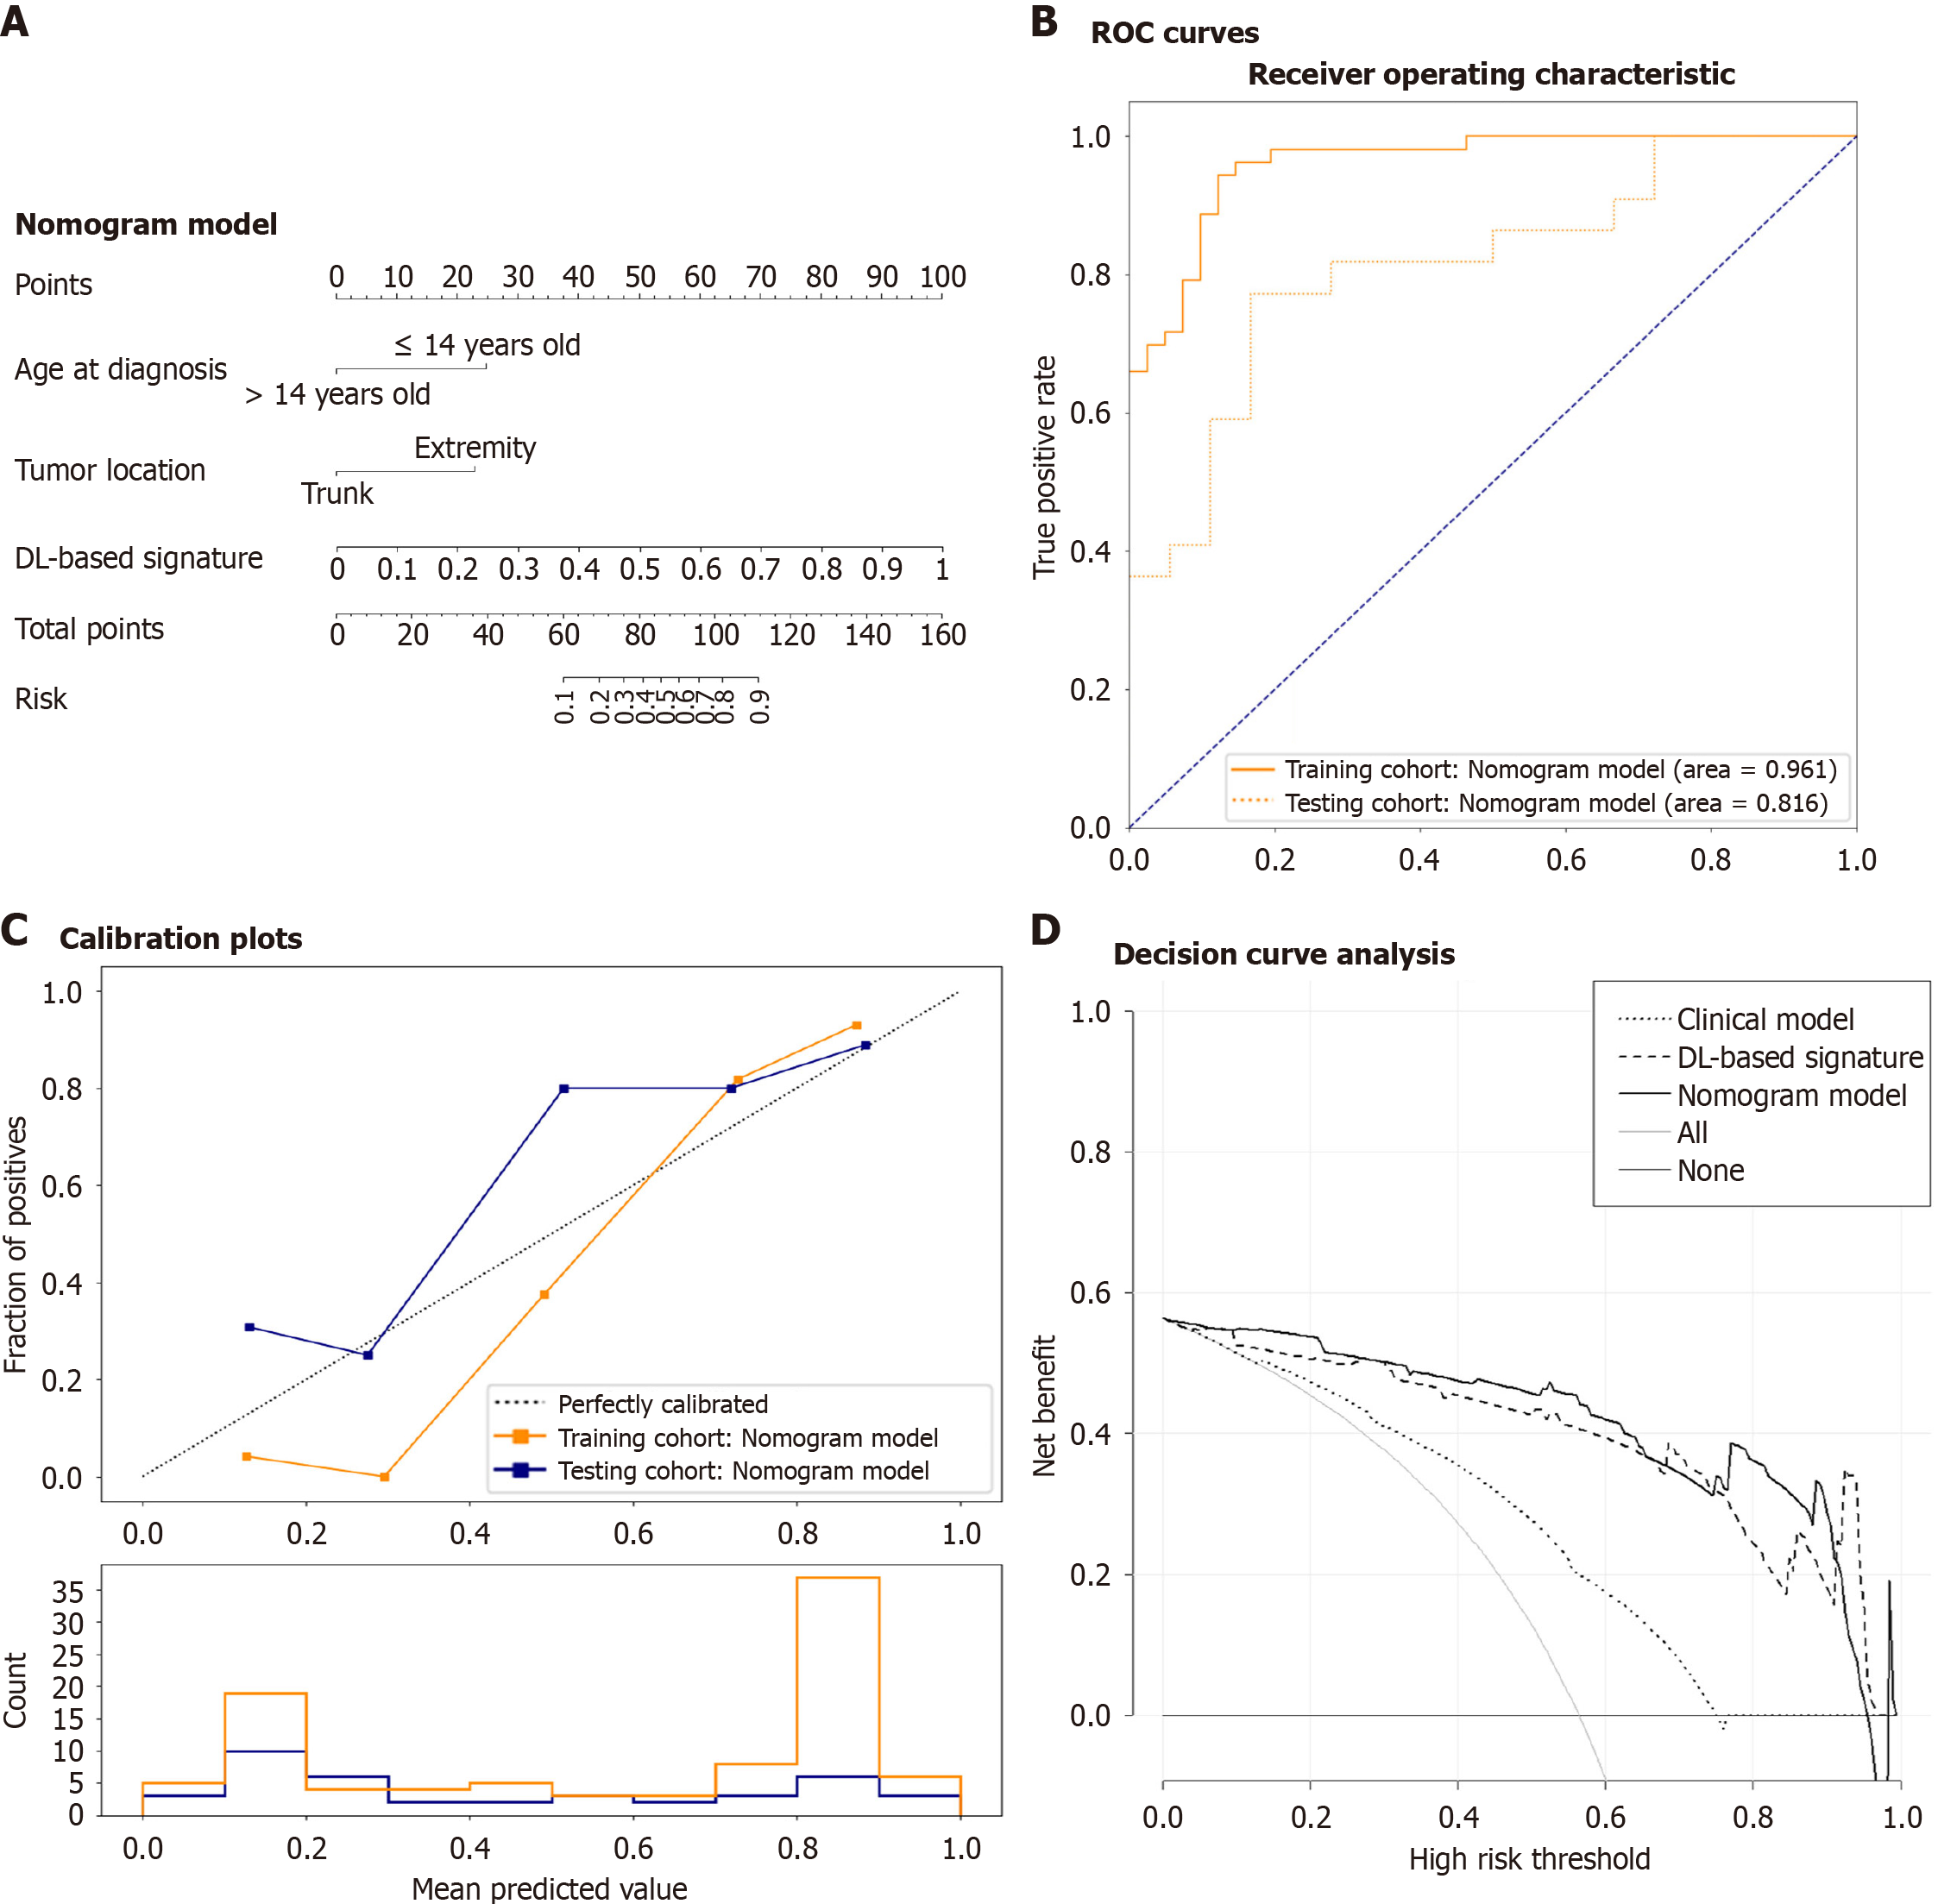
Figure 3 Evaluation of predictive performances for response to neoadjuvant chemotherapy for the integrated nomogram model in adolescents and young adults with osteosarcoma.
A: Nomogram model combining significant clinical variables, age at diagnosis and tumor location, and the deep learning-based signature generated from the best deep learning-magnetic resonance imaging model considering area under the receiver operating characteristics curve of the testing cohort among all models; B: Receiver operating characteristic curves for the predictive performance of integrated nomogram model for response to neoadjuvant chemotherapy in the training and testing cohorts, respectively; C: Curves of the calibration analysis for the integrated nomogram model for response to neoadjuvant chemotherapy in the training and testing cohorts, respectively; D: The decision curve analysis of the integrated nomogram model for response to neoadjuvant chemotherapy. DL: Deep learning; ROC: Receiver operating characteristic.
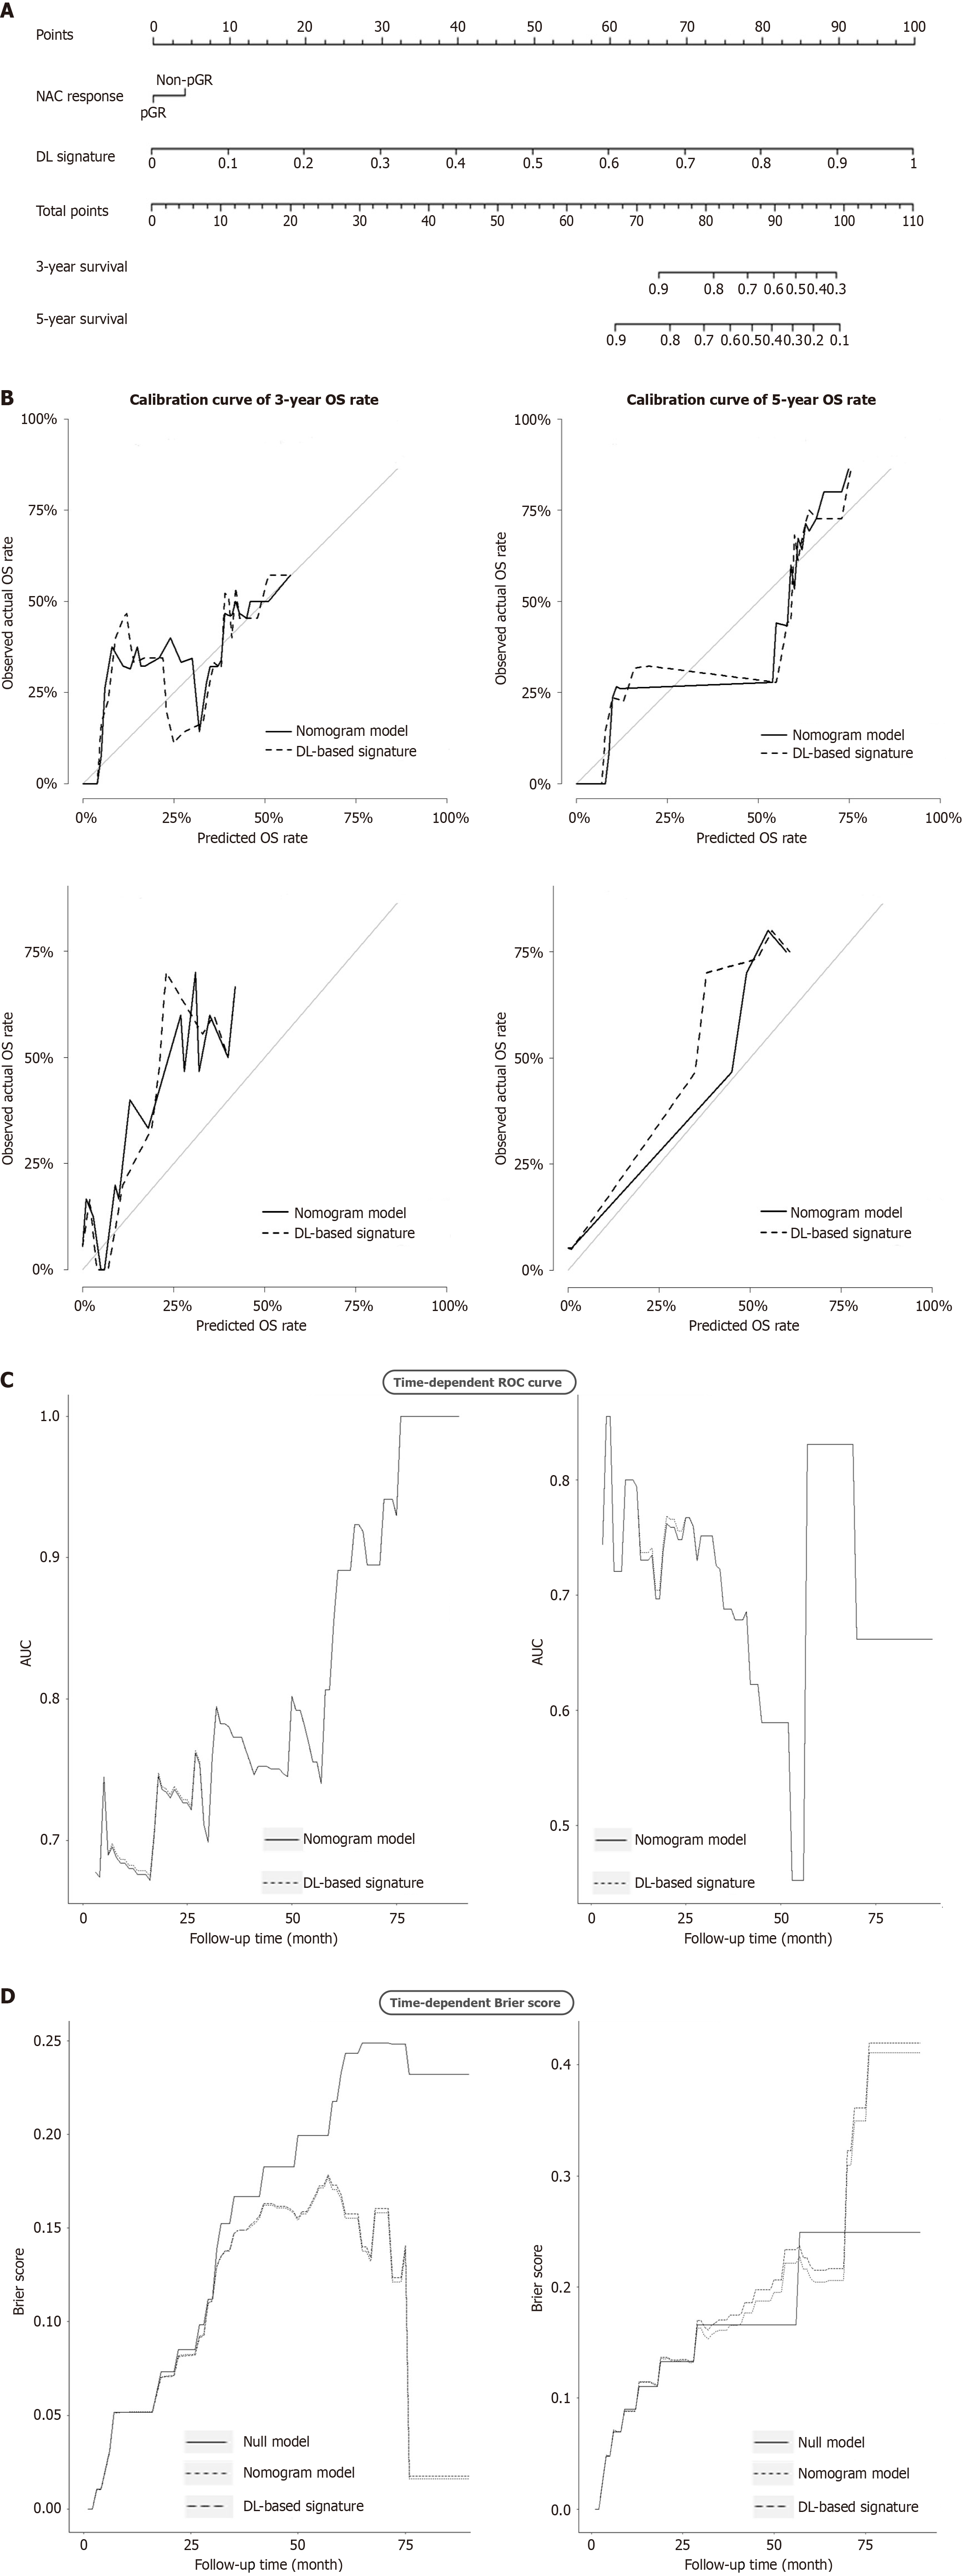
Figure 4 Development and performance evaluation of the integrated prognostic model and the deep learning-based signature for prediction of overall survival in adolescents and young adults with osteosarcoma.
A: Nomogram model in prediction of 3-year and 5-year overall survival (OS) combining prognostic clinical variables and the deep learning (DL)-based signature from treatment prediction in the training and testing cohort; B: Calibration curves in measurement of predicted 3-year (left) and 5-year (right) survival probabilities in the training (upper) and testing (lower) cohorts. The X-axis represented predicted survival risks, while the Y-axis showed observational survival probabilities. The line Y = X performed the ideal agreement between the estimated and actual survival probabilities; C: Time-dependent receiver operating characteristic analysis for the DL-based signature and the integrated nomogram model on OS showing the fluctuation of area under the receiver operating characteristics curves with follow-up in the training and testing cohorts; D: Time-dependent Brier scores for the DL-based signature and the integrated nomogram model on OS in the training and testing cohorts. NAC: Neoadjuvant chemotherapy; DL: Deep learning; OS: Overall survival; ROC: Receiver operating characteristic; AUC: Area under the receiver operating characteristic curve.
- Citation: Yang YH. Magnetic resonance imaging-based deep learning model for prediction of the neoadjuvant chemotherapy response and survival prognosis in adolescents with osteosarcoma. Artif Intell Cancer 2026; 7(1): 116460
- URL: https://www.wjgnet.com/2644-3228/full/v7/i1/116460.htm
- DOI: https://dx.doi.org/10.35713/aic.v7.i1.116460