Copyright
©The Author(s) 2024.
Artif Intell Cancer. Jul 18, 2024; 5(1): 96690
Published online Jul 18, 2024. doi: 10.35713/aic.v5.i1.96690
Published online Jul 18, 2024. doi: 10.35713/aic.v5.i1.96690
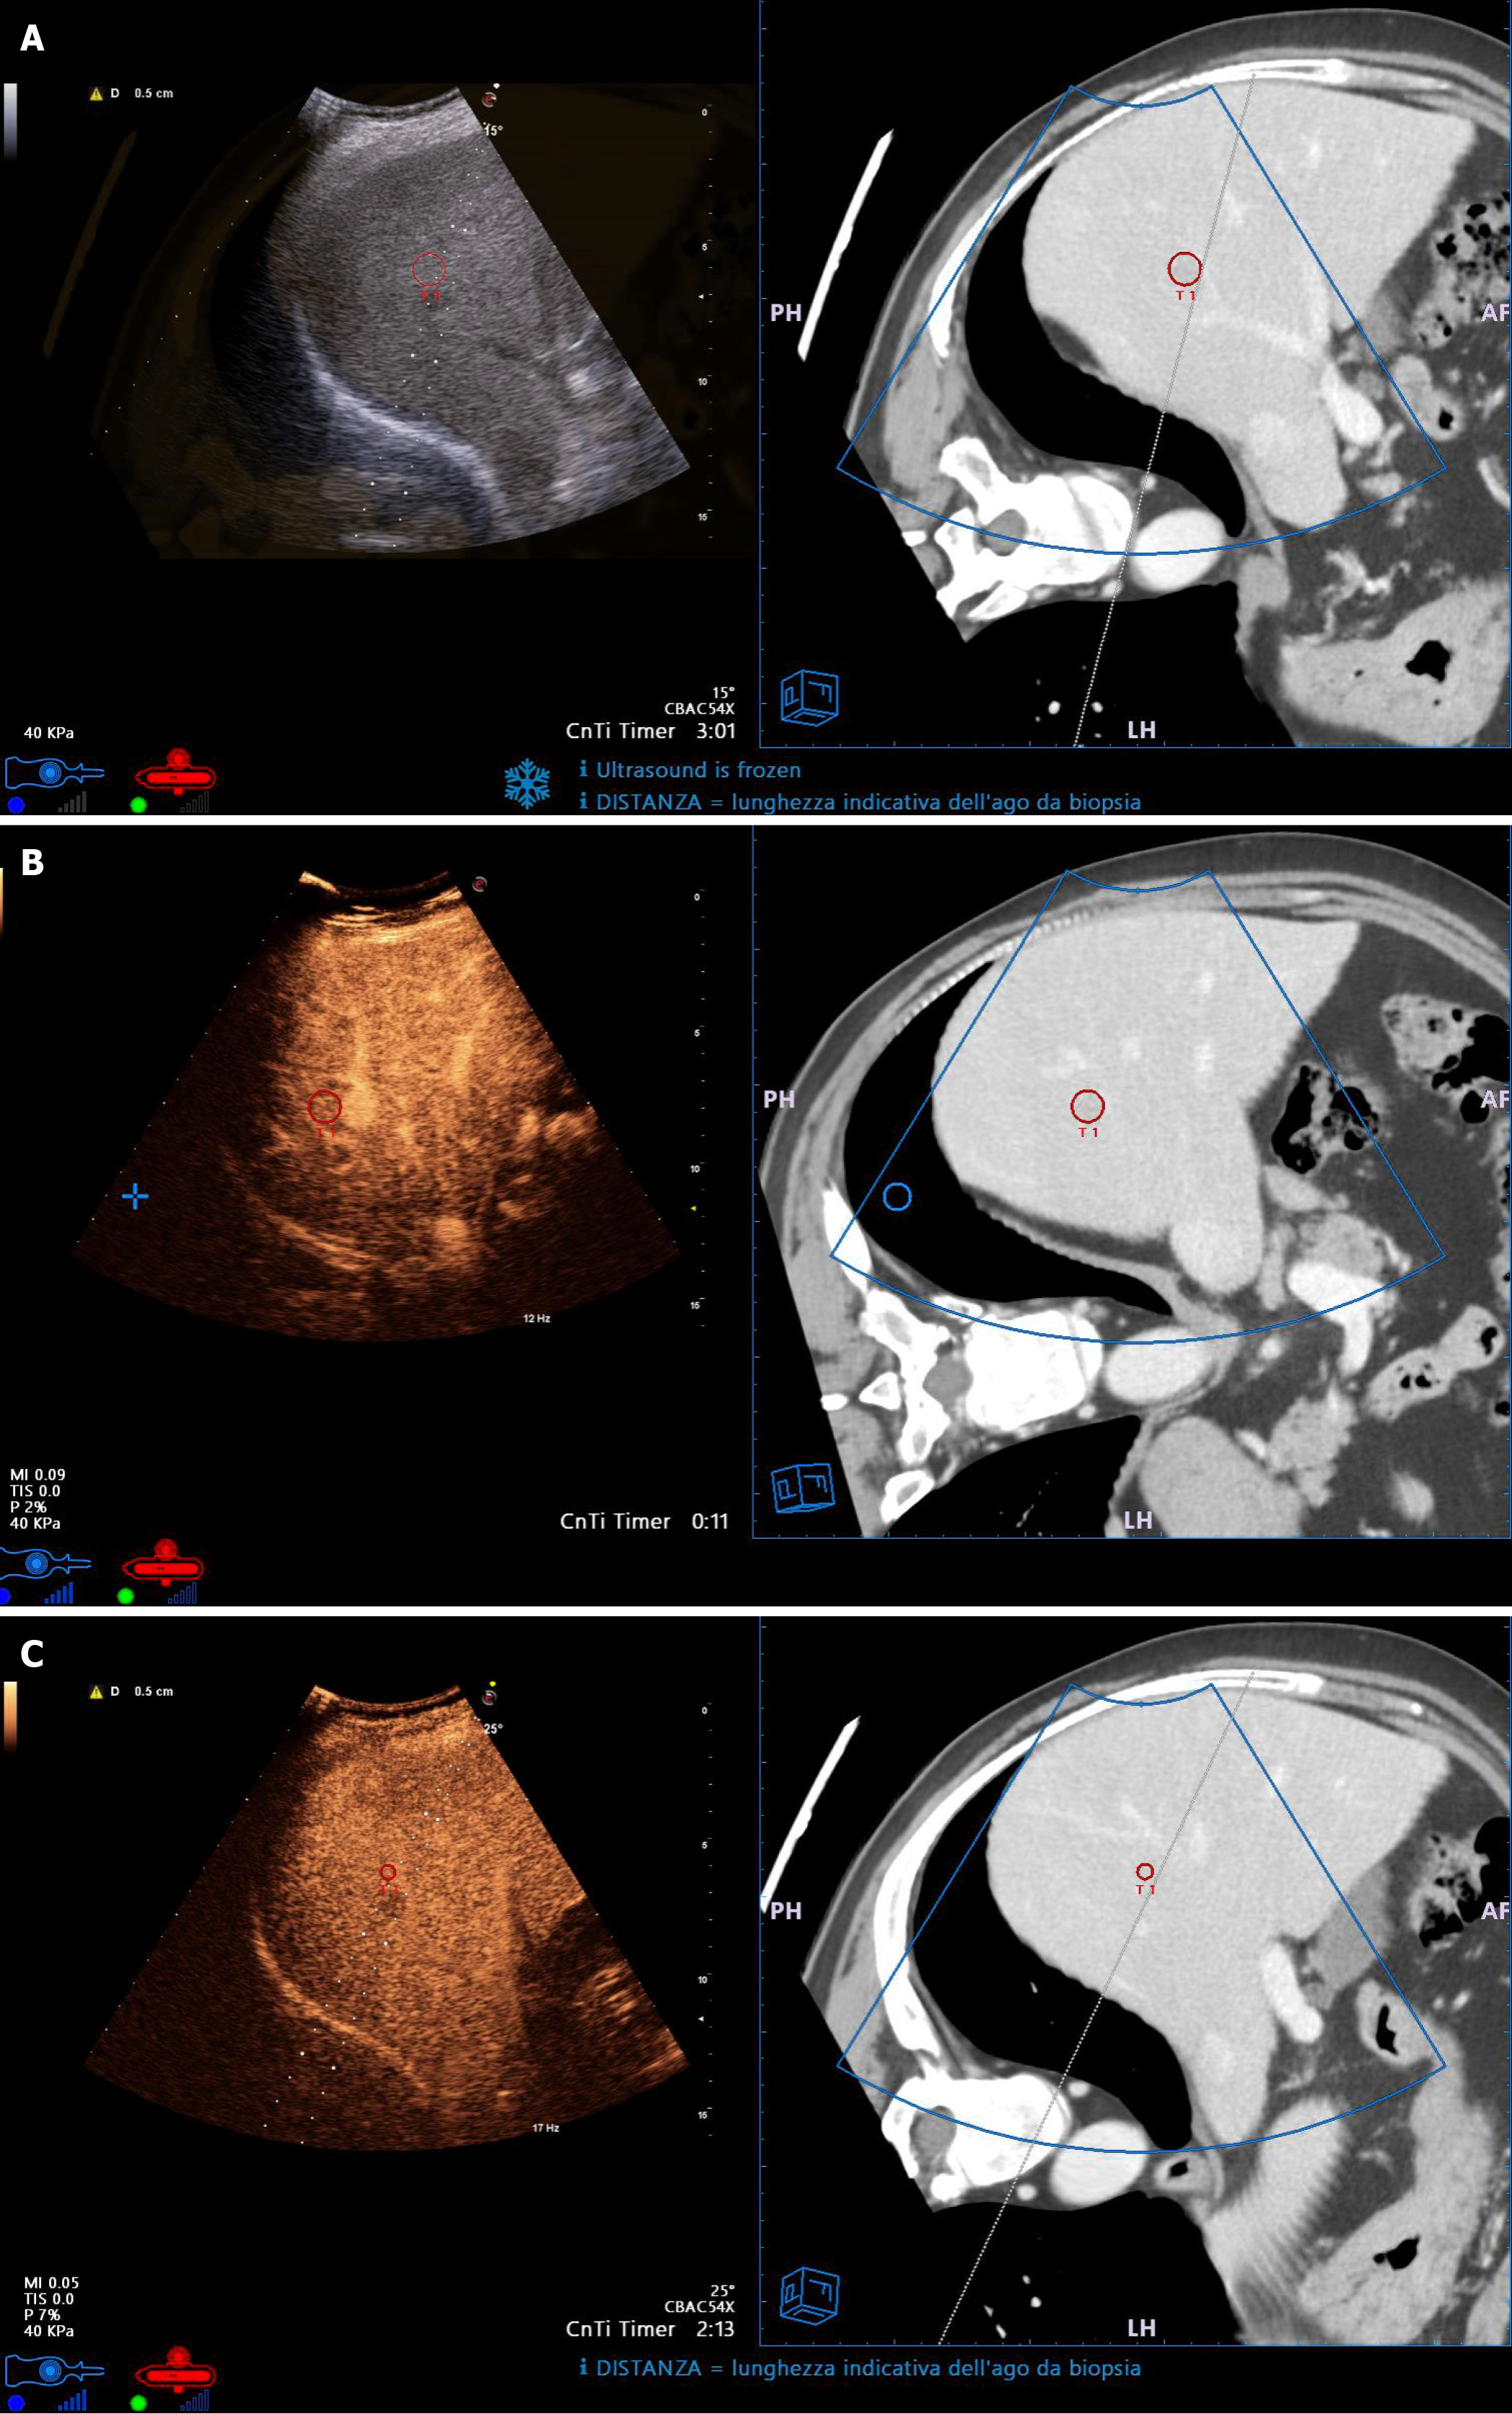
Figure 1 Small hepatocellular carcinoma with low visibility on ultrasound.
A: Fusion Imaging (FI) allows to precisely identify and target the lesion (red circlet in both left and right sides of the split screen); B: Contrast-enhanced ultrasound (CEUS) shows hyperhancement in the arterial phase (left side of the split screen); C: CEUS shows wash-out in the portal-venous phase (left side of the split screen). FI allows correct guidance of the needle electrode insertion for thermal ablation (dotted line in CEUS images, continuous line in Computed Tomography images).
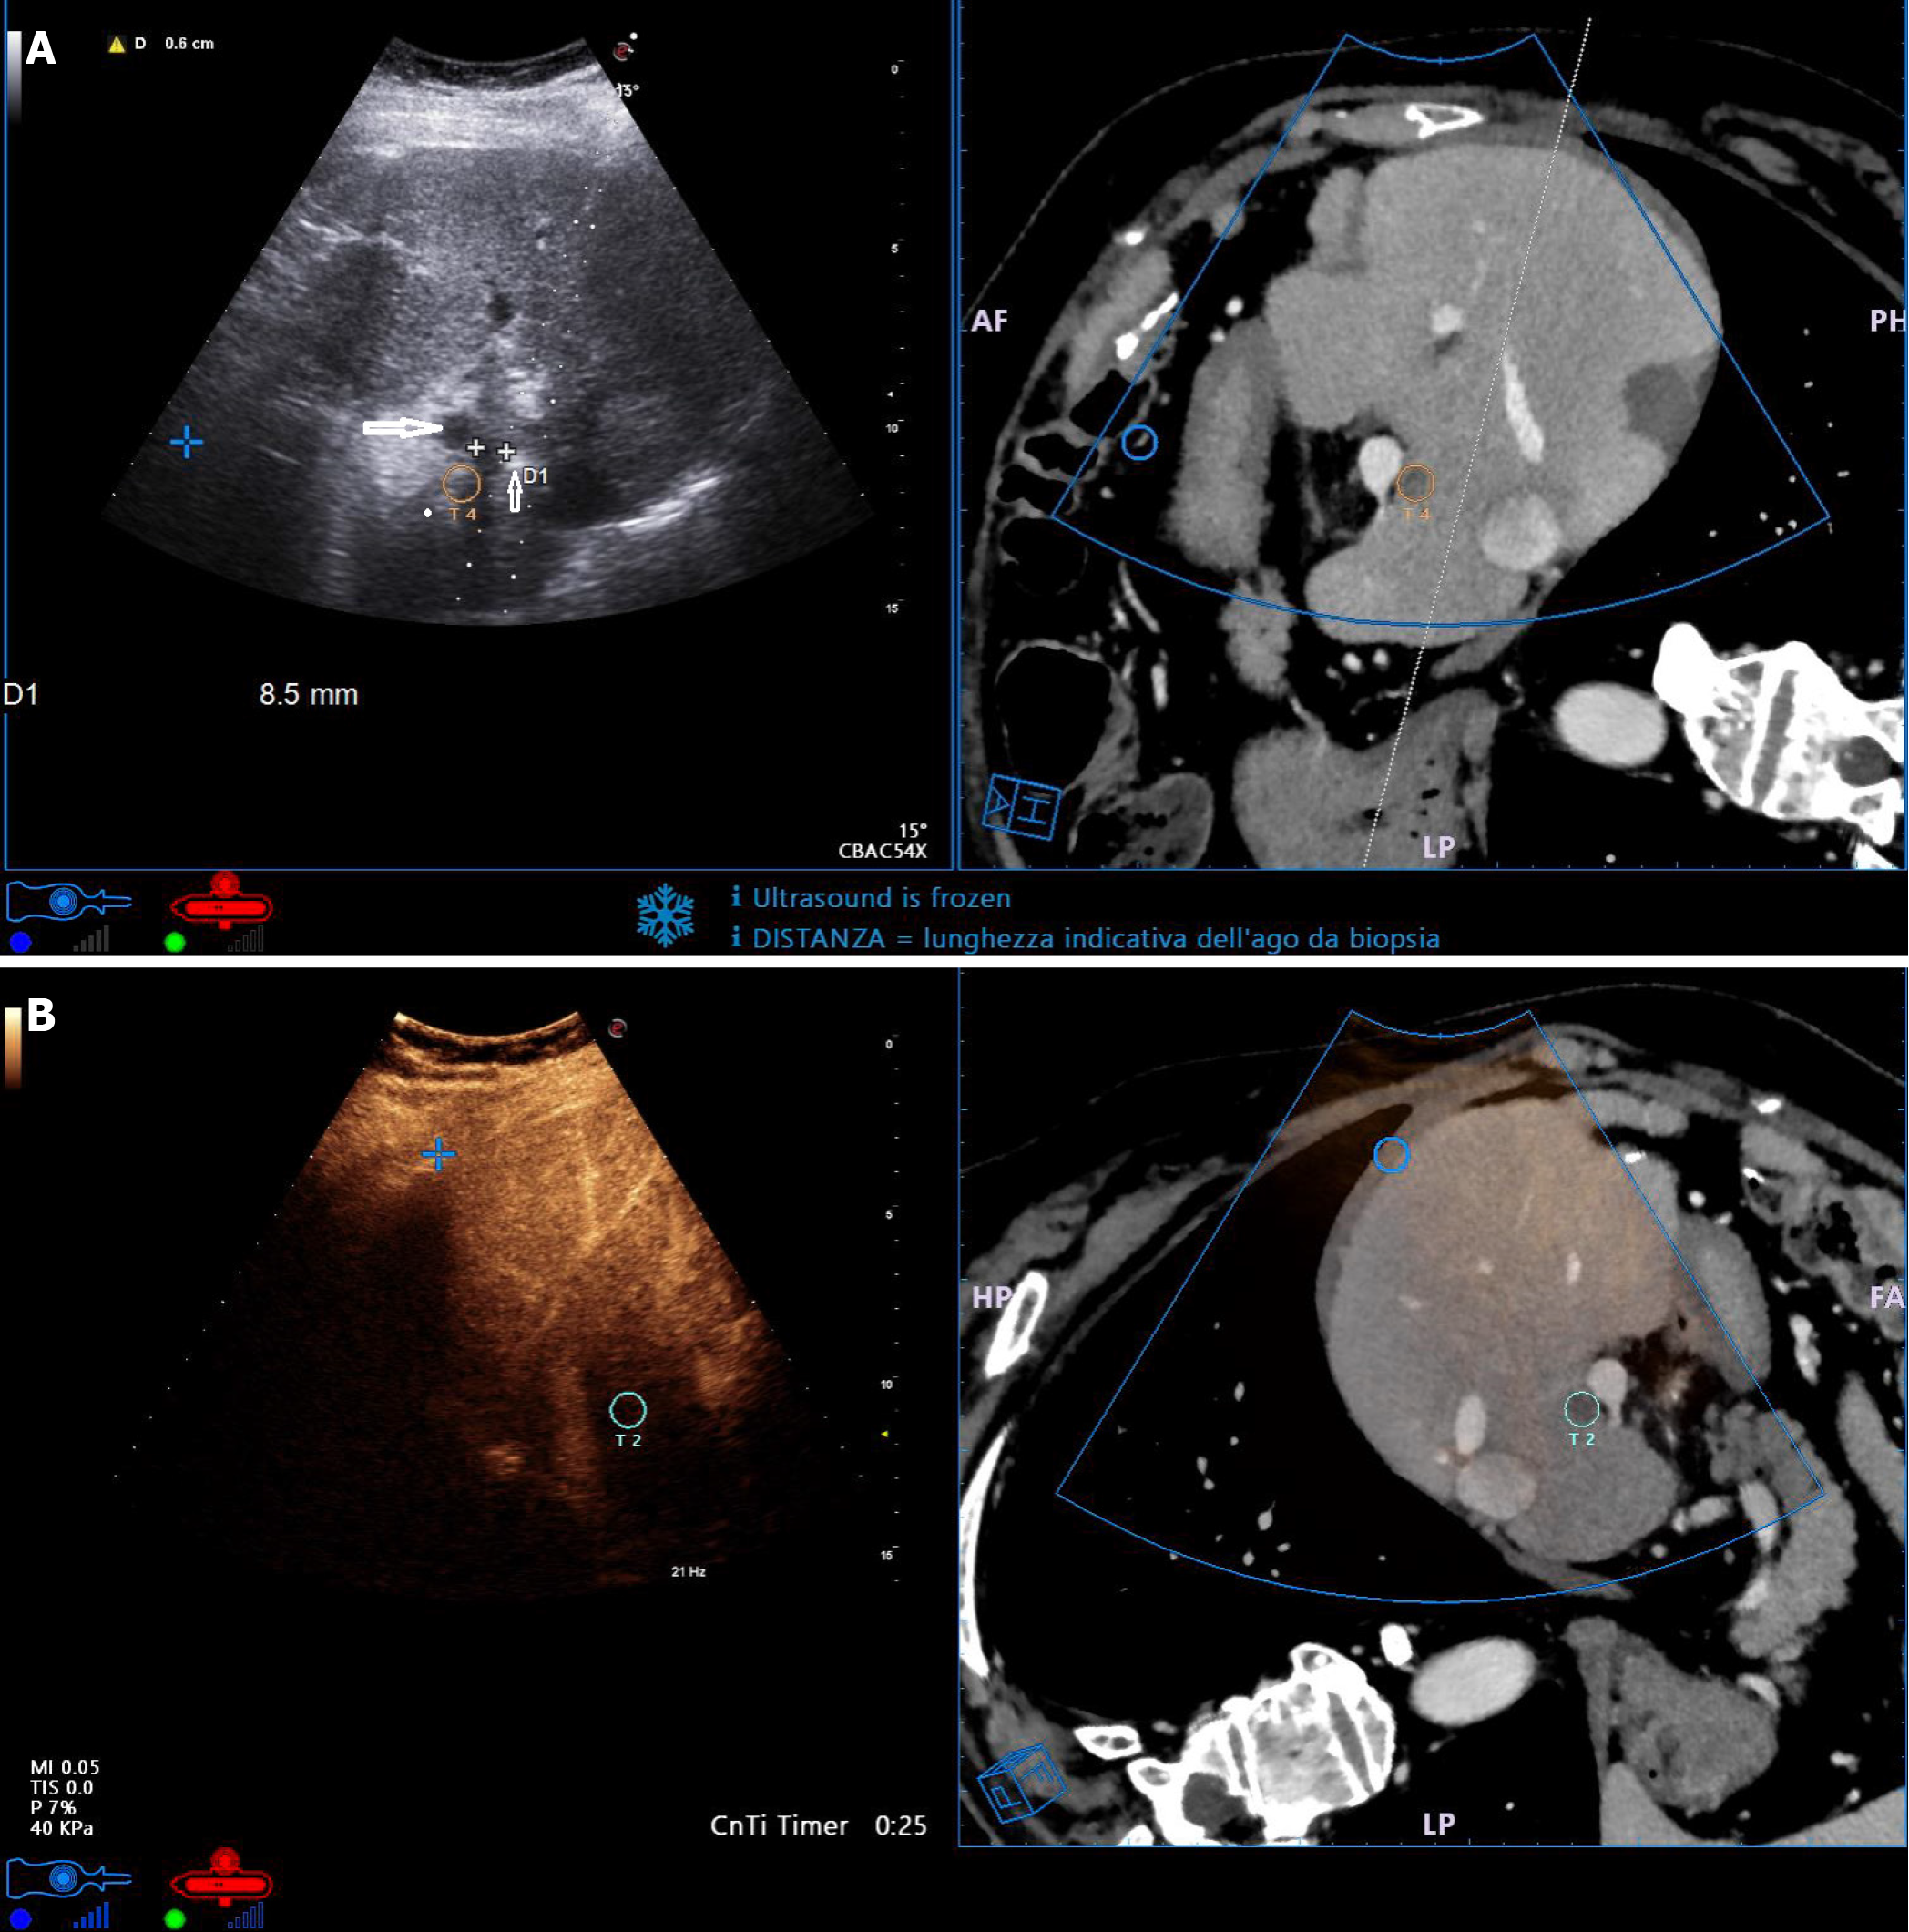
Figure 2 Fusion imaging of small metastasis from colorectal cancer in difficult and high-risk location.
A: The lesion was close to the portal vein (white cross-shaped markers in ultrasound image, yellow circle in computed tomography image). The needle tip was correctly placed lateral of the lesion (thin arrow) to maintain a safe distance from the portal vein (large arrow); B: CEUS scan performed 10 min after thermal ablation (with ultrasound transducer orientation inverted compared to Figure 3A) showed complete necrosis. Fusion imaging confirmed the presence of safety ablation margins around the targeted lesion.
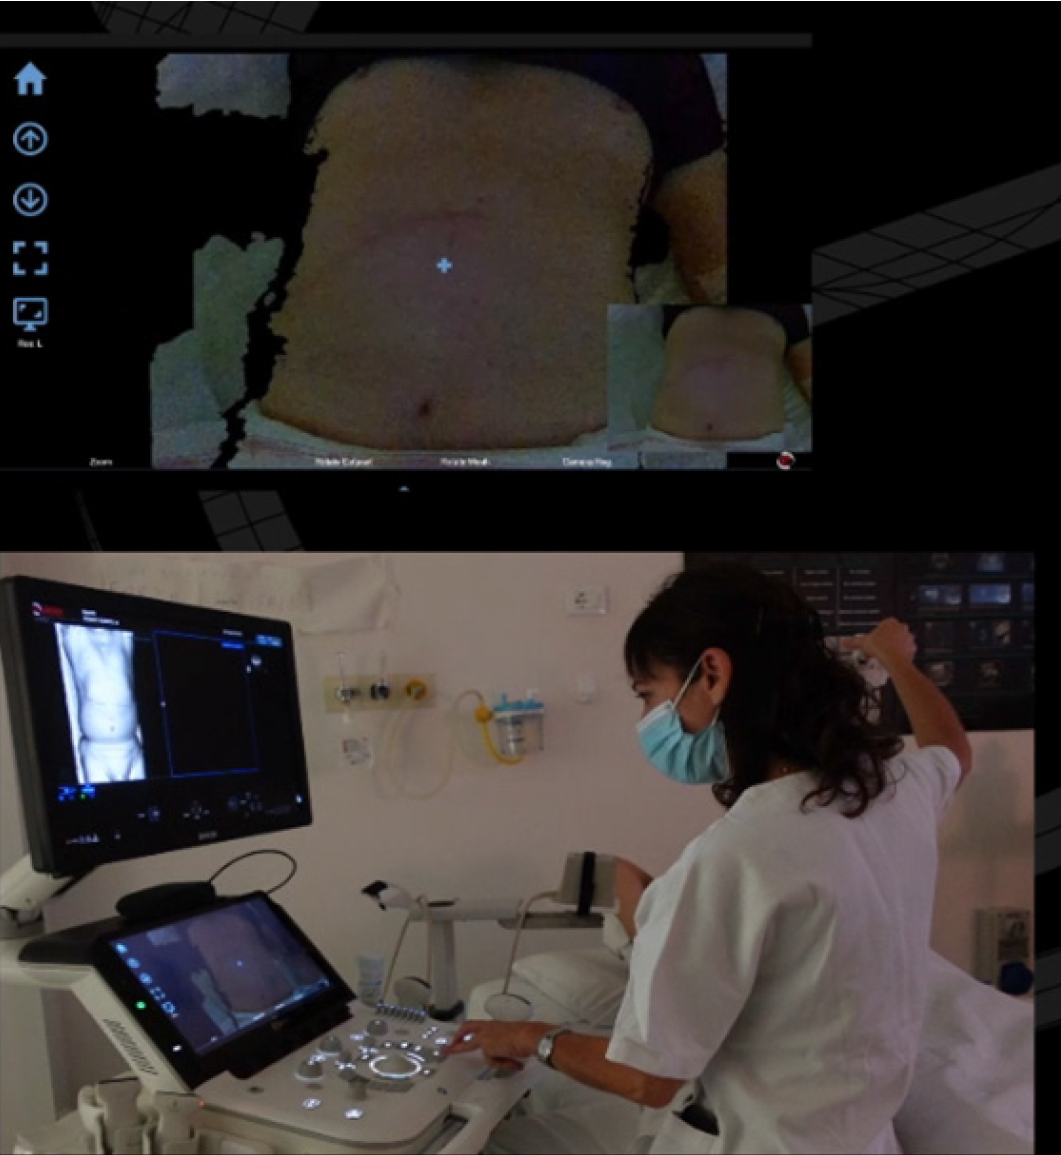
Figure 3
Three-dimensional camera positioned over the patient’s abdomen captured detailed images of the skin surface.
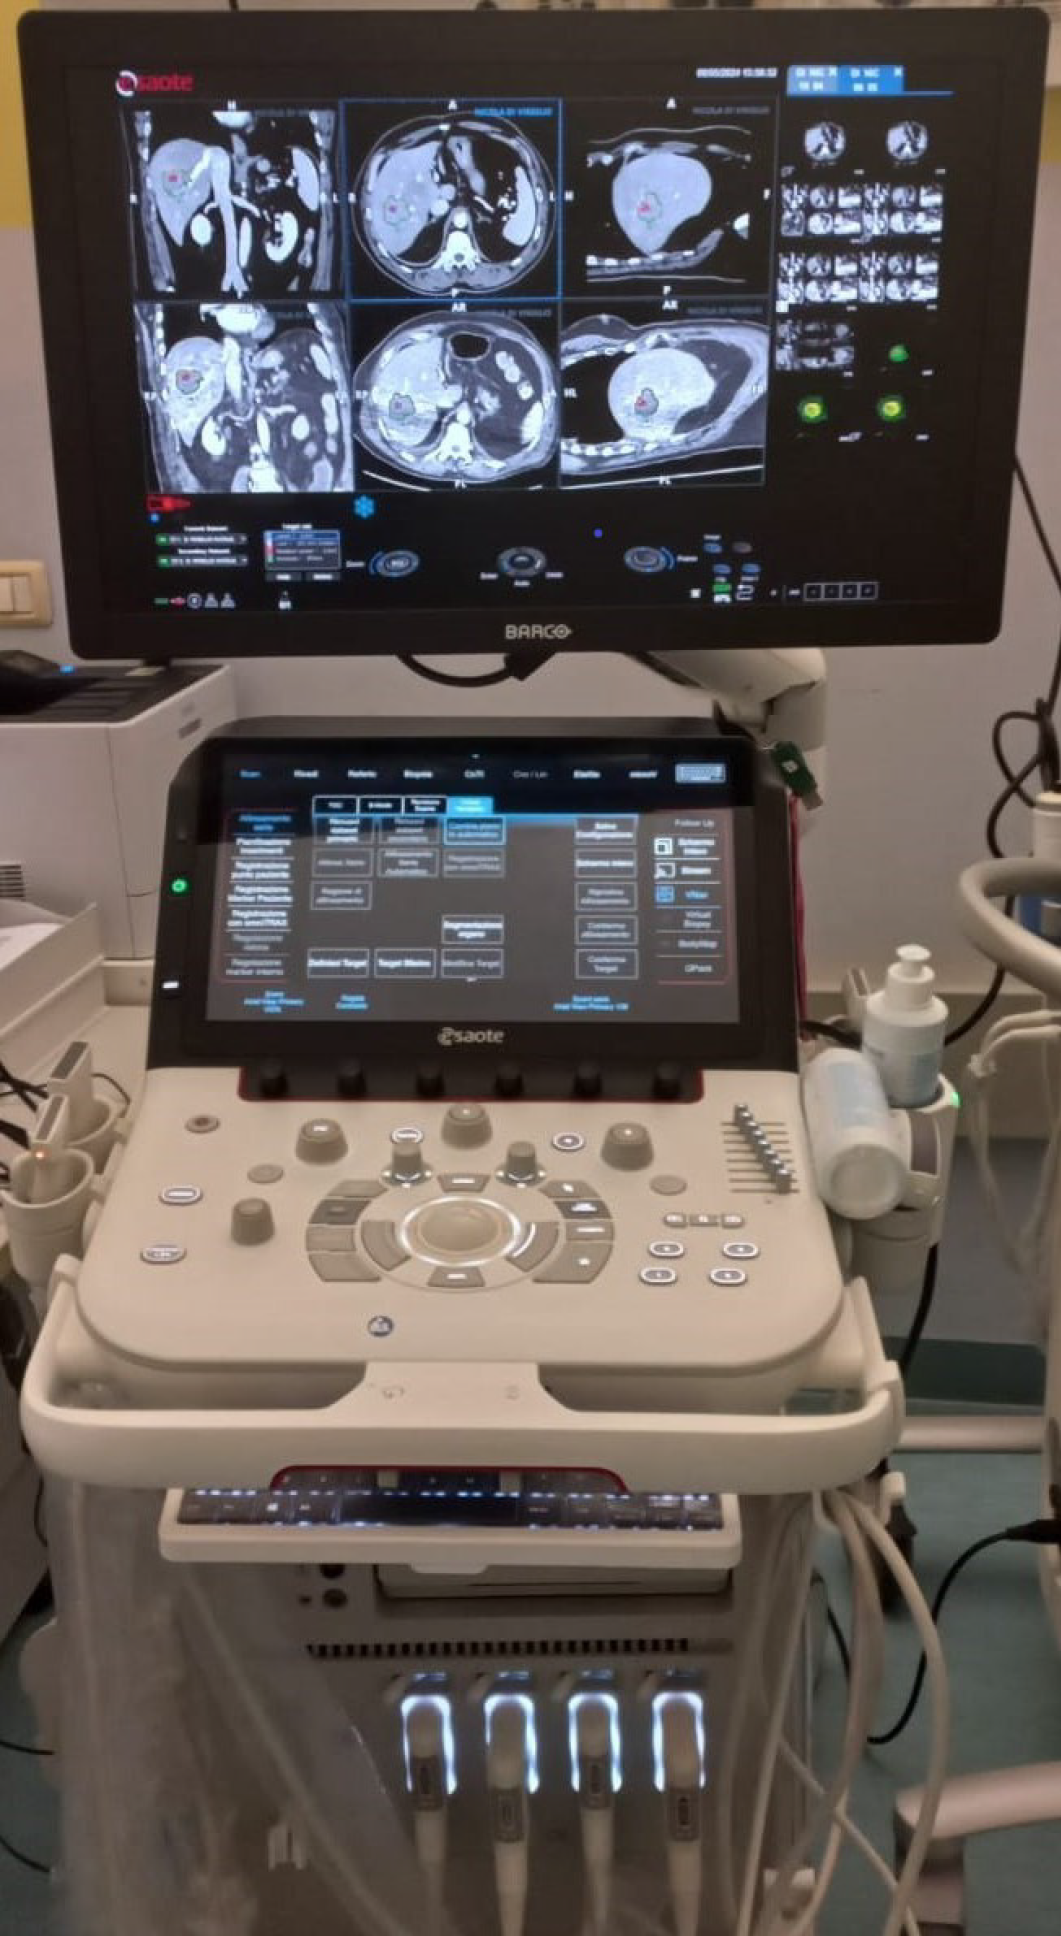
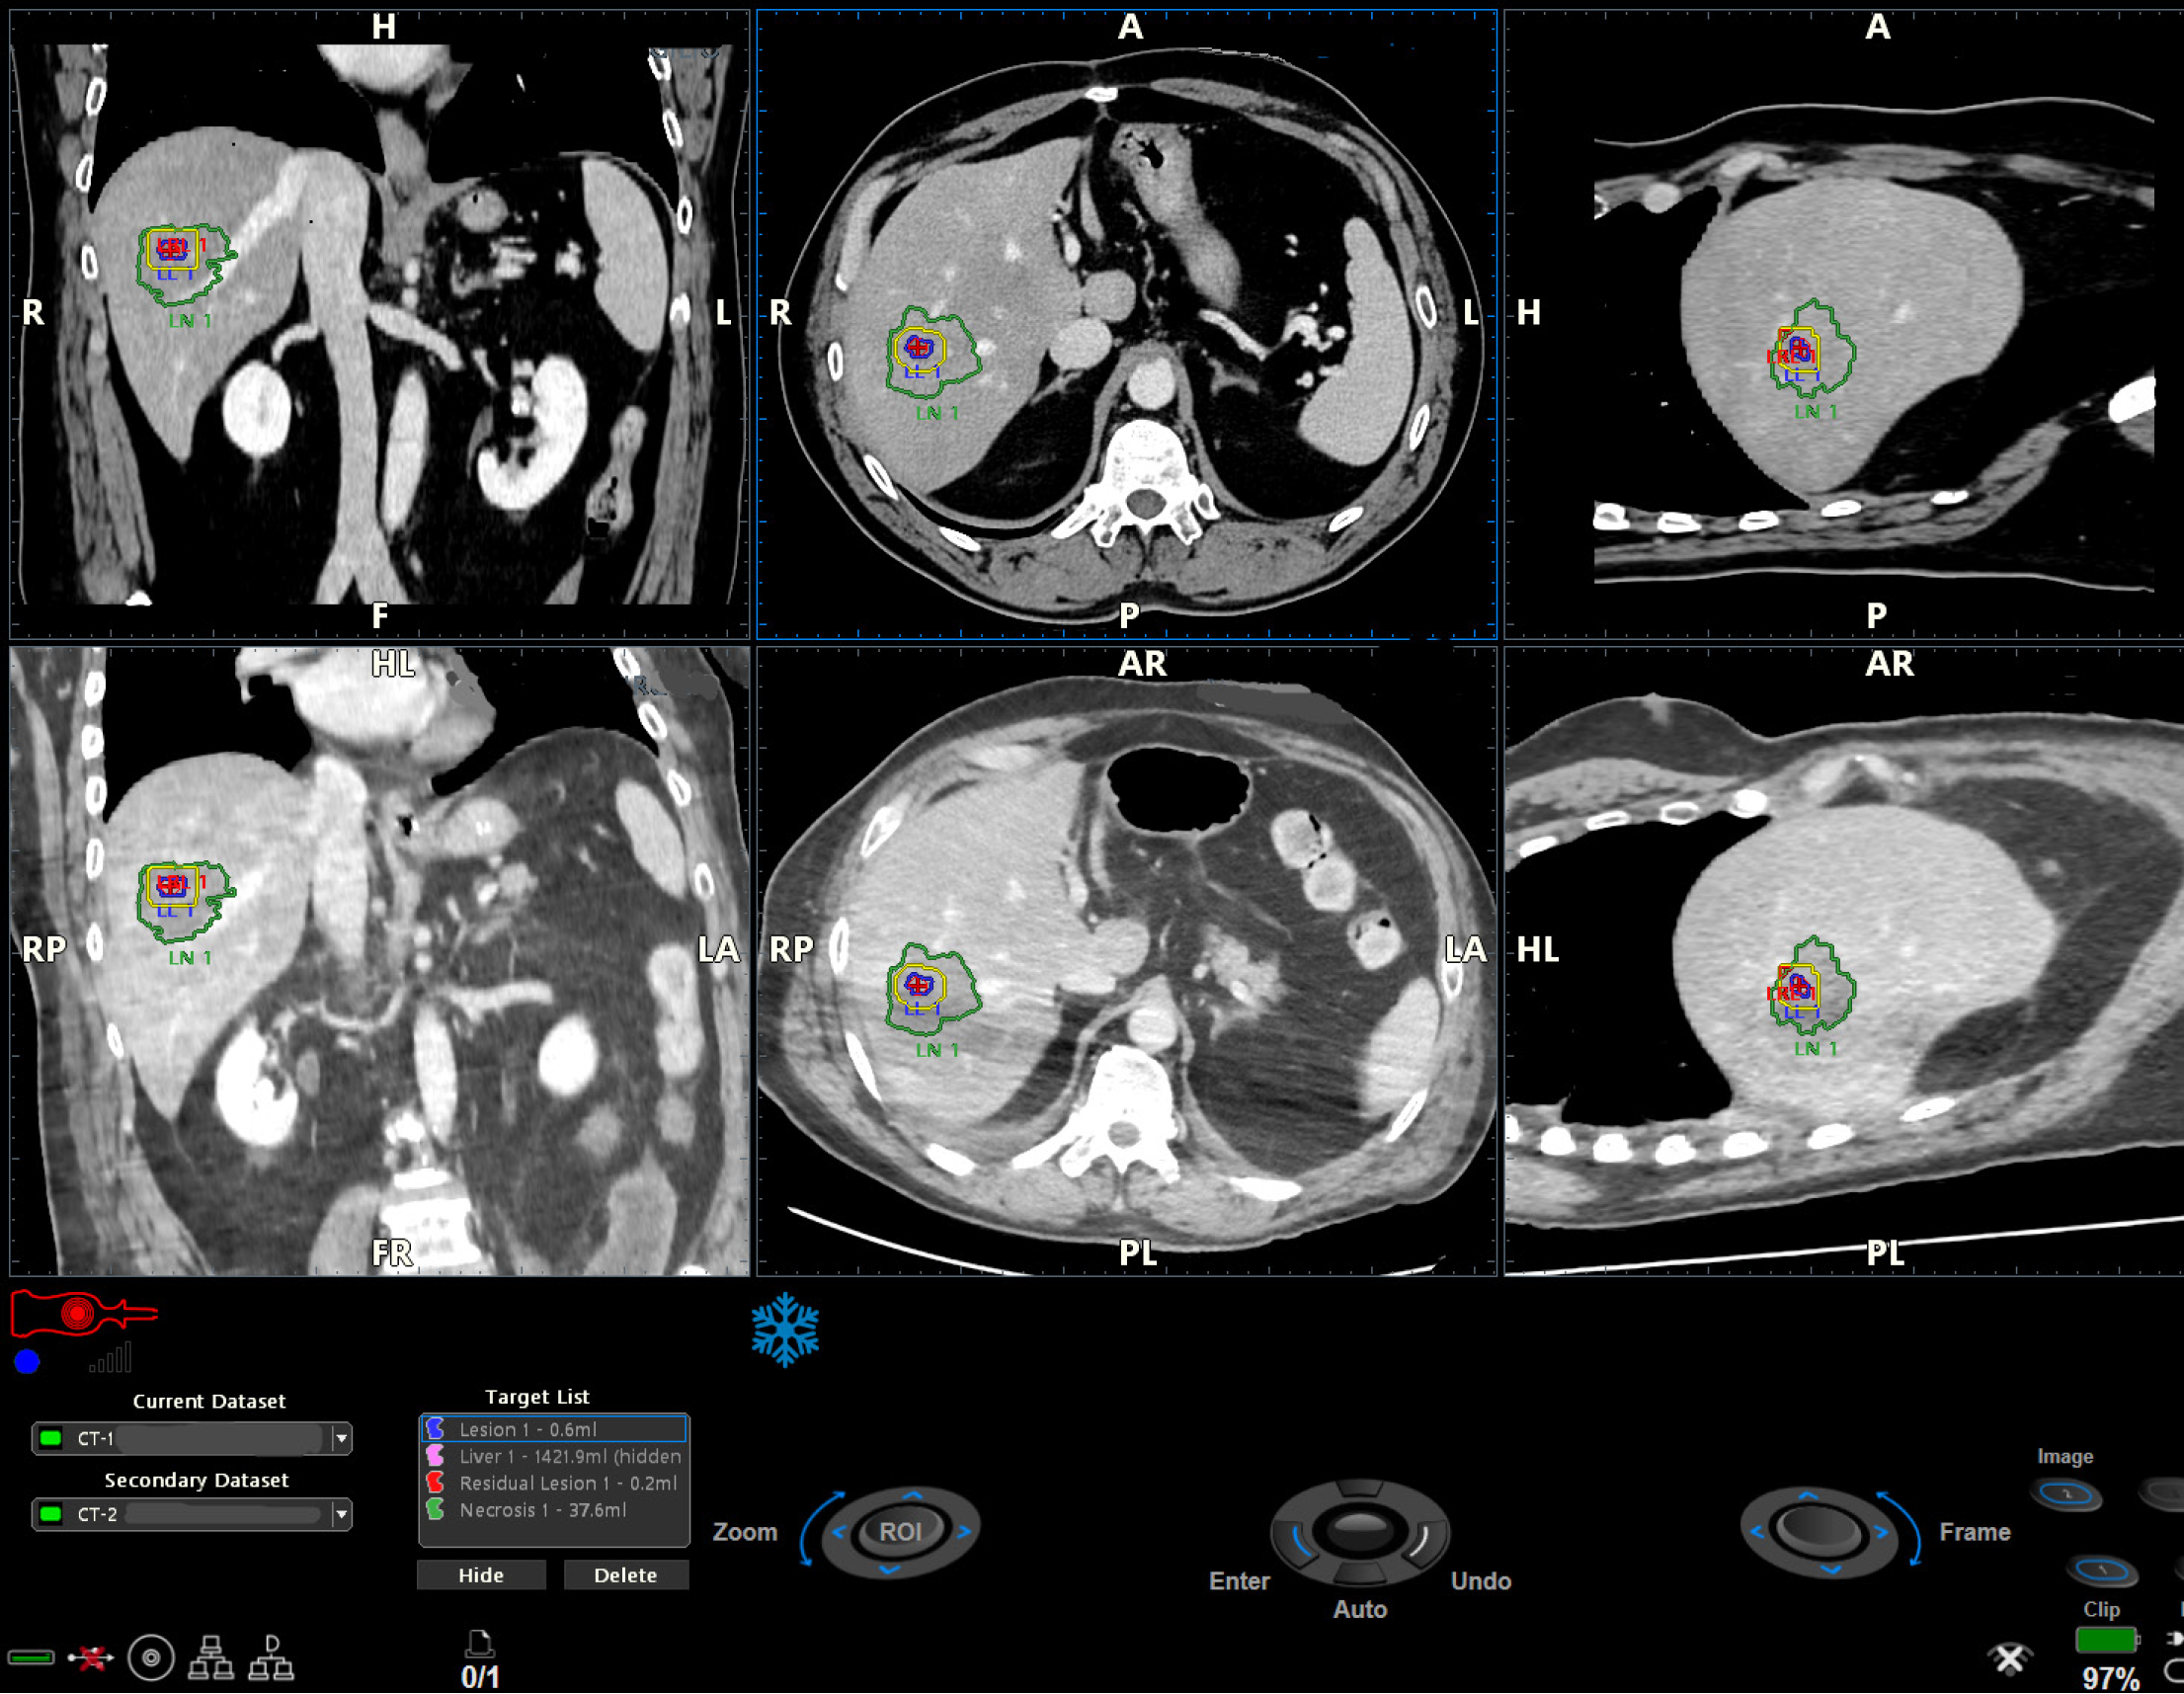
Figure 4 Augmented Ablation Suite.
Pre-ablation and post-ablation computed tomography datasets are displayed on the monitor of the ultrasound machine.
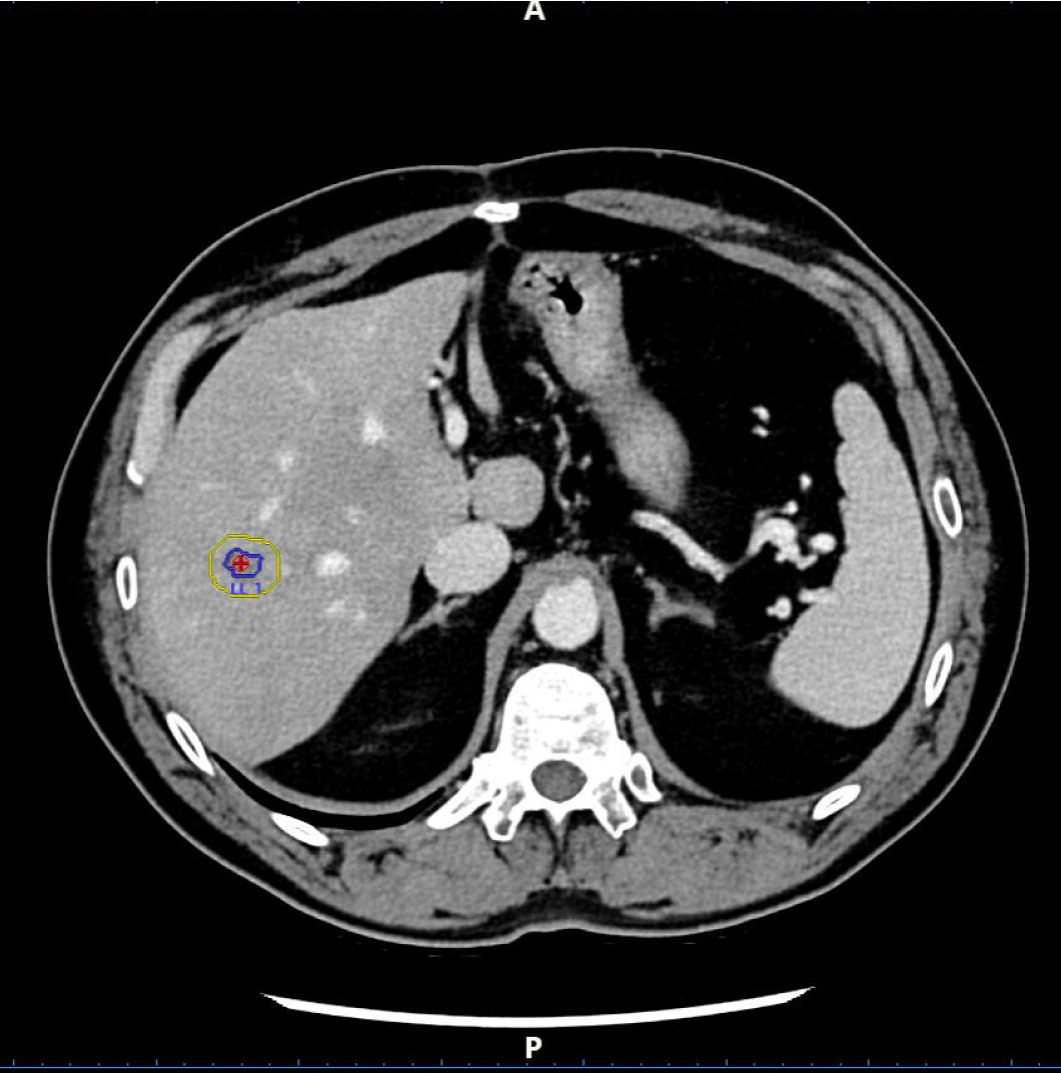
Figure 5 Pre-ablation two-dimensional computed tomography.
The target lesion (red circle) was circumscribed scan by scan by the operator (blue line), and the software calculated the safety margin (yellow line).
Figure 6
Detail of Figure 4: The pre-ablation dataset (upper series), the post-ablation dataset (lower series), the lesion (red circle and blue line), the safety margin calculated by the software (yellow perimeter), and the necrosis area (green perimeter) are displayed in the three plans.
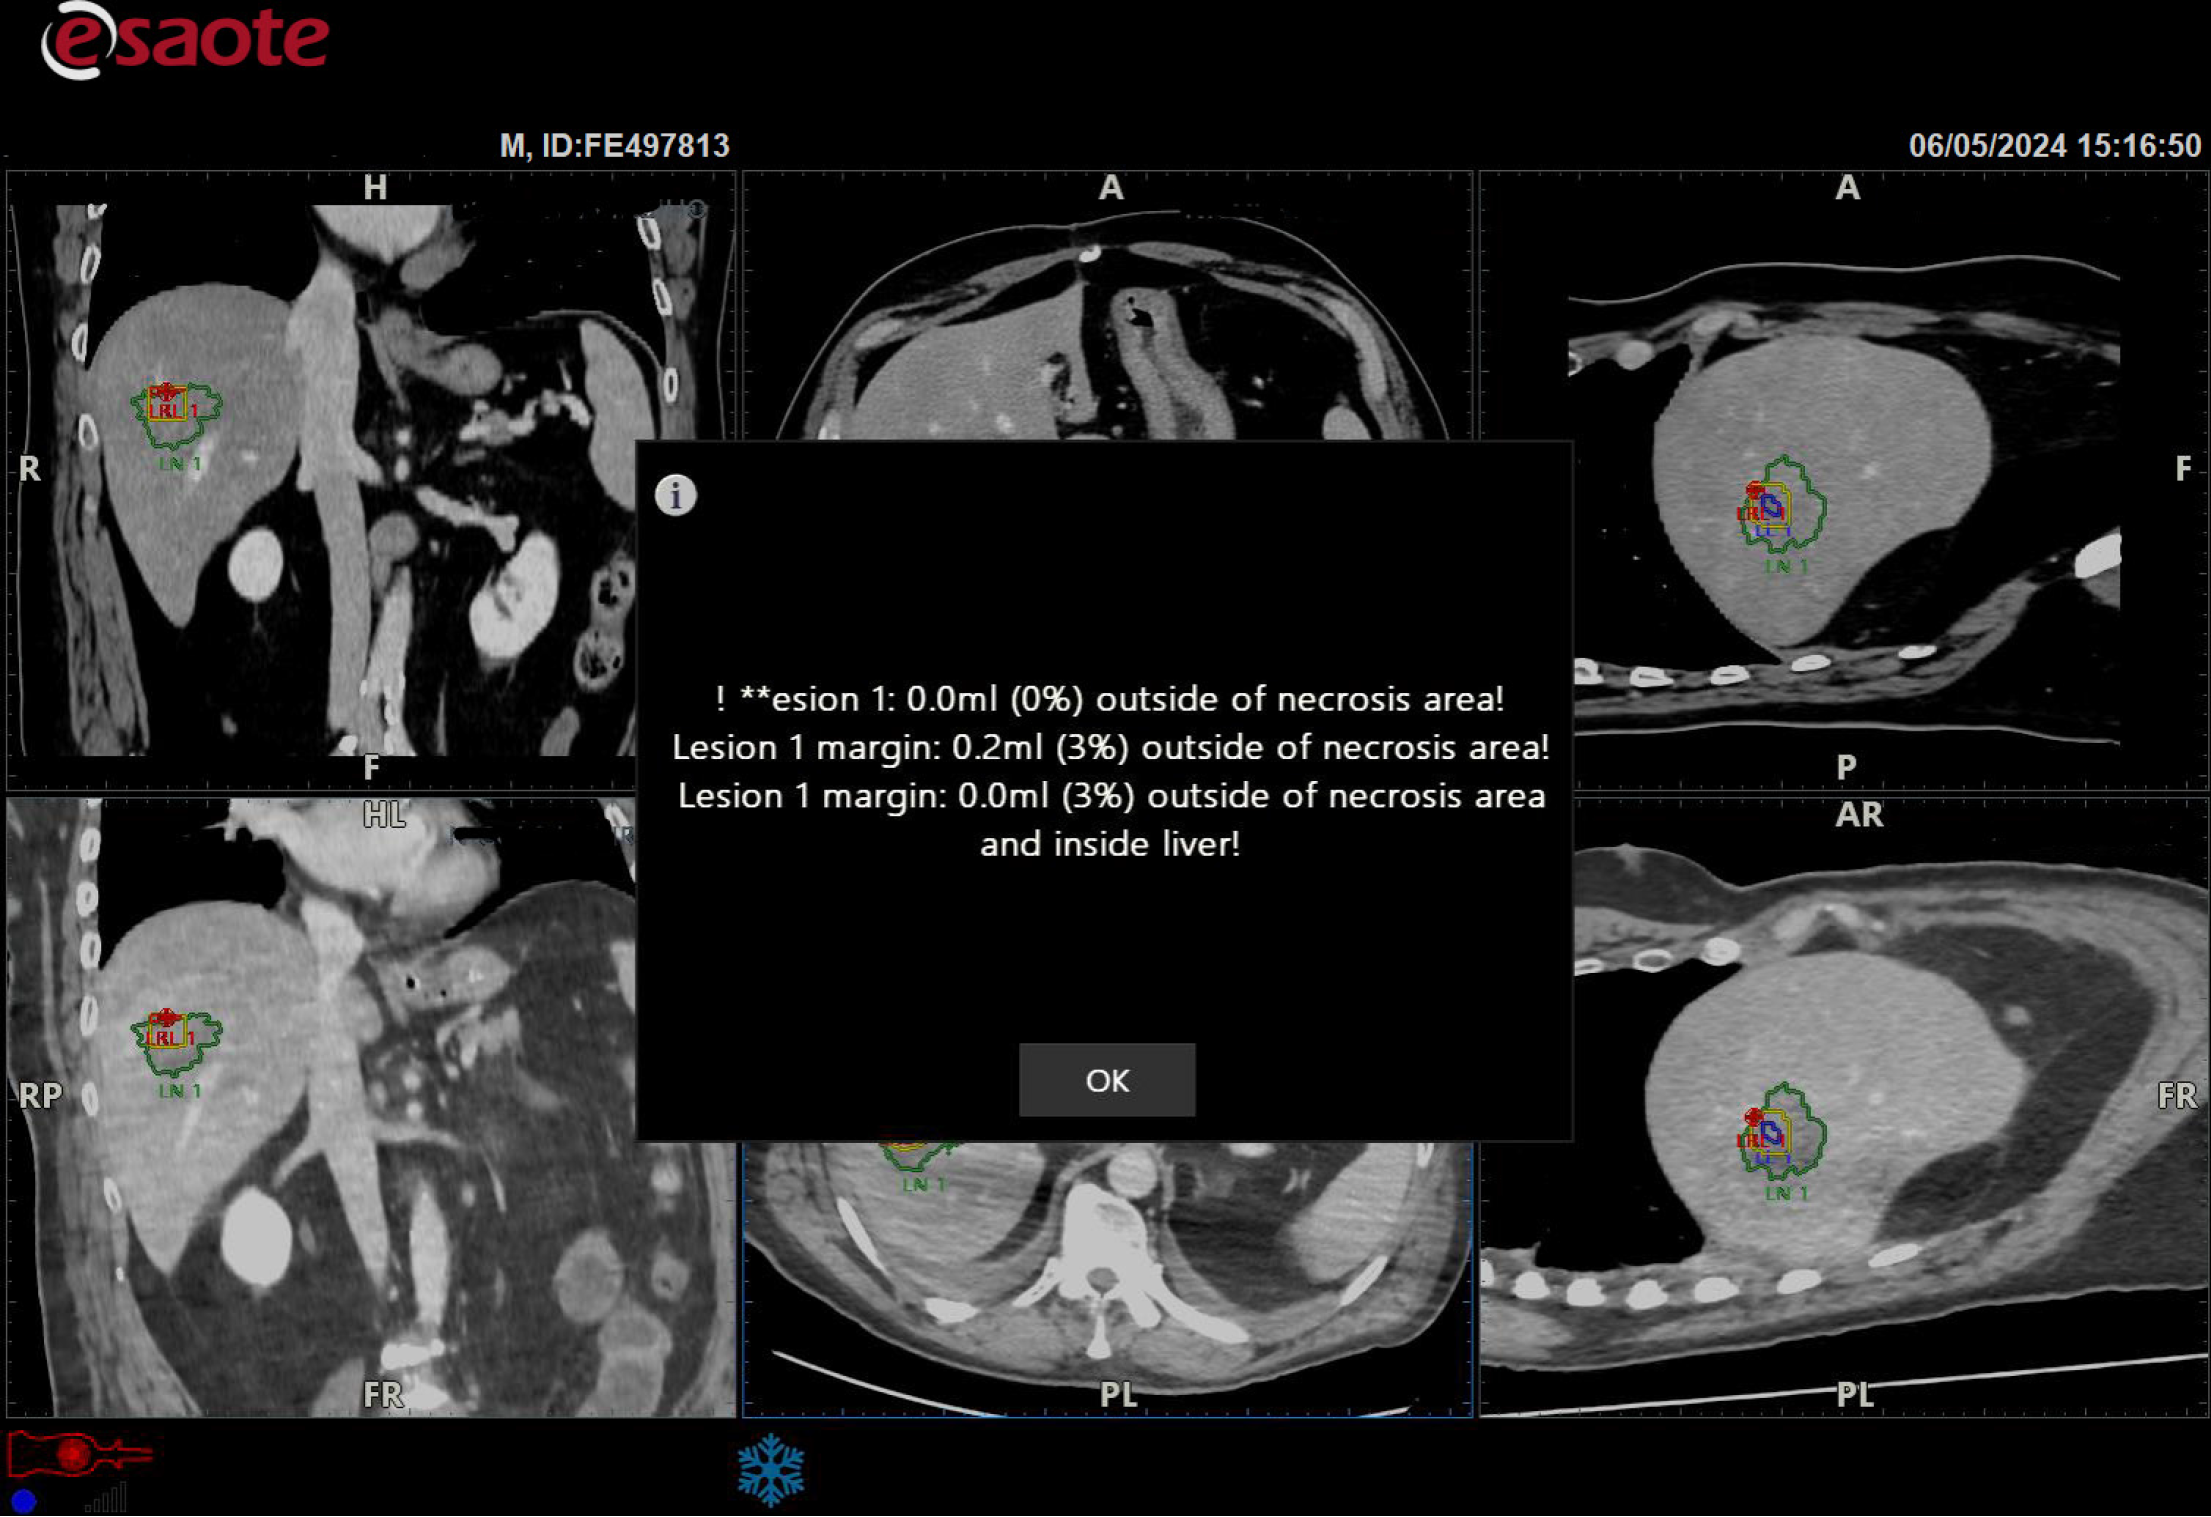
Figure 7
The target lesion was within the necrotic area, but the software warned that the safety margin was insufficient (red spot).
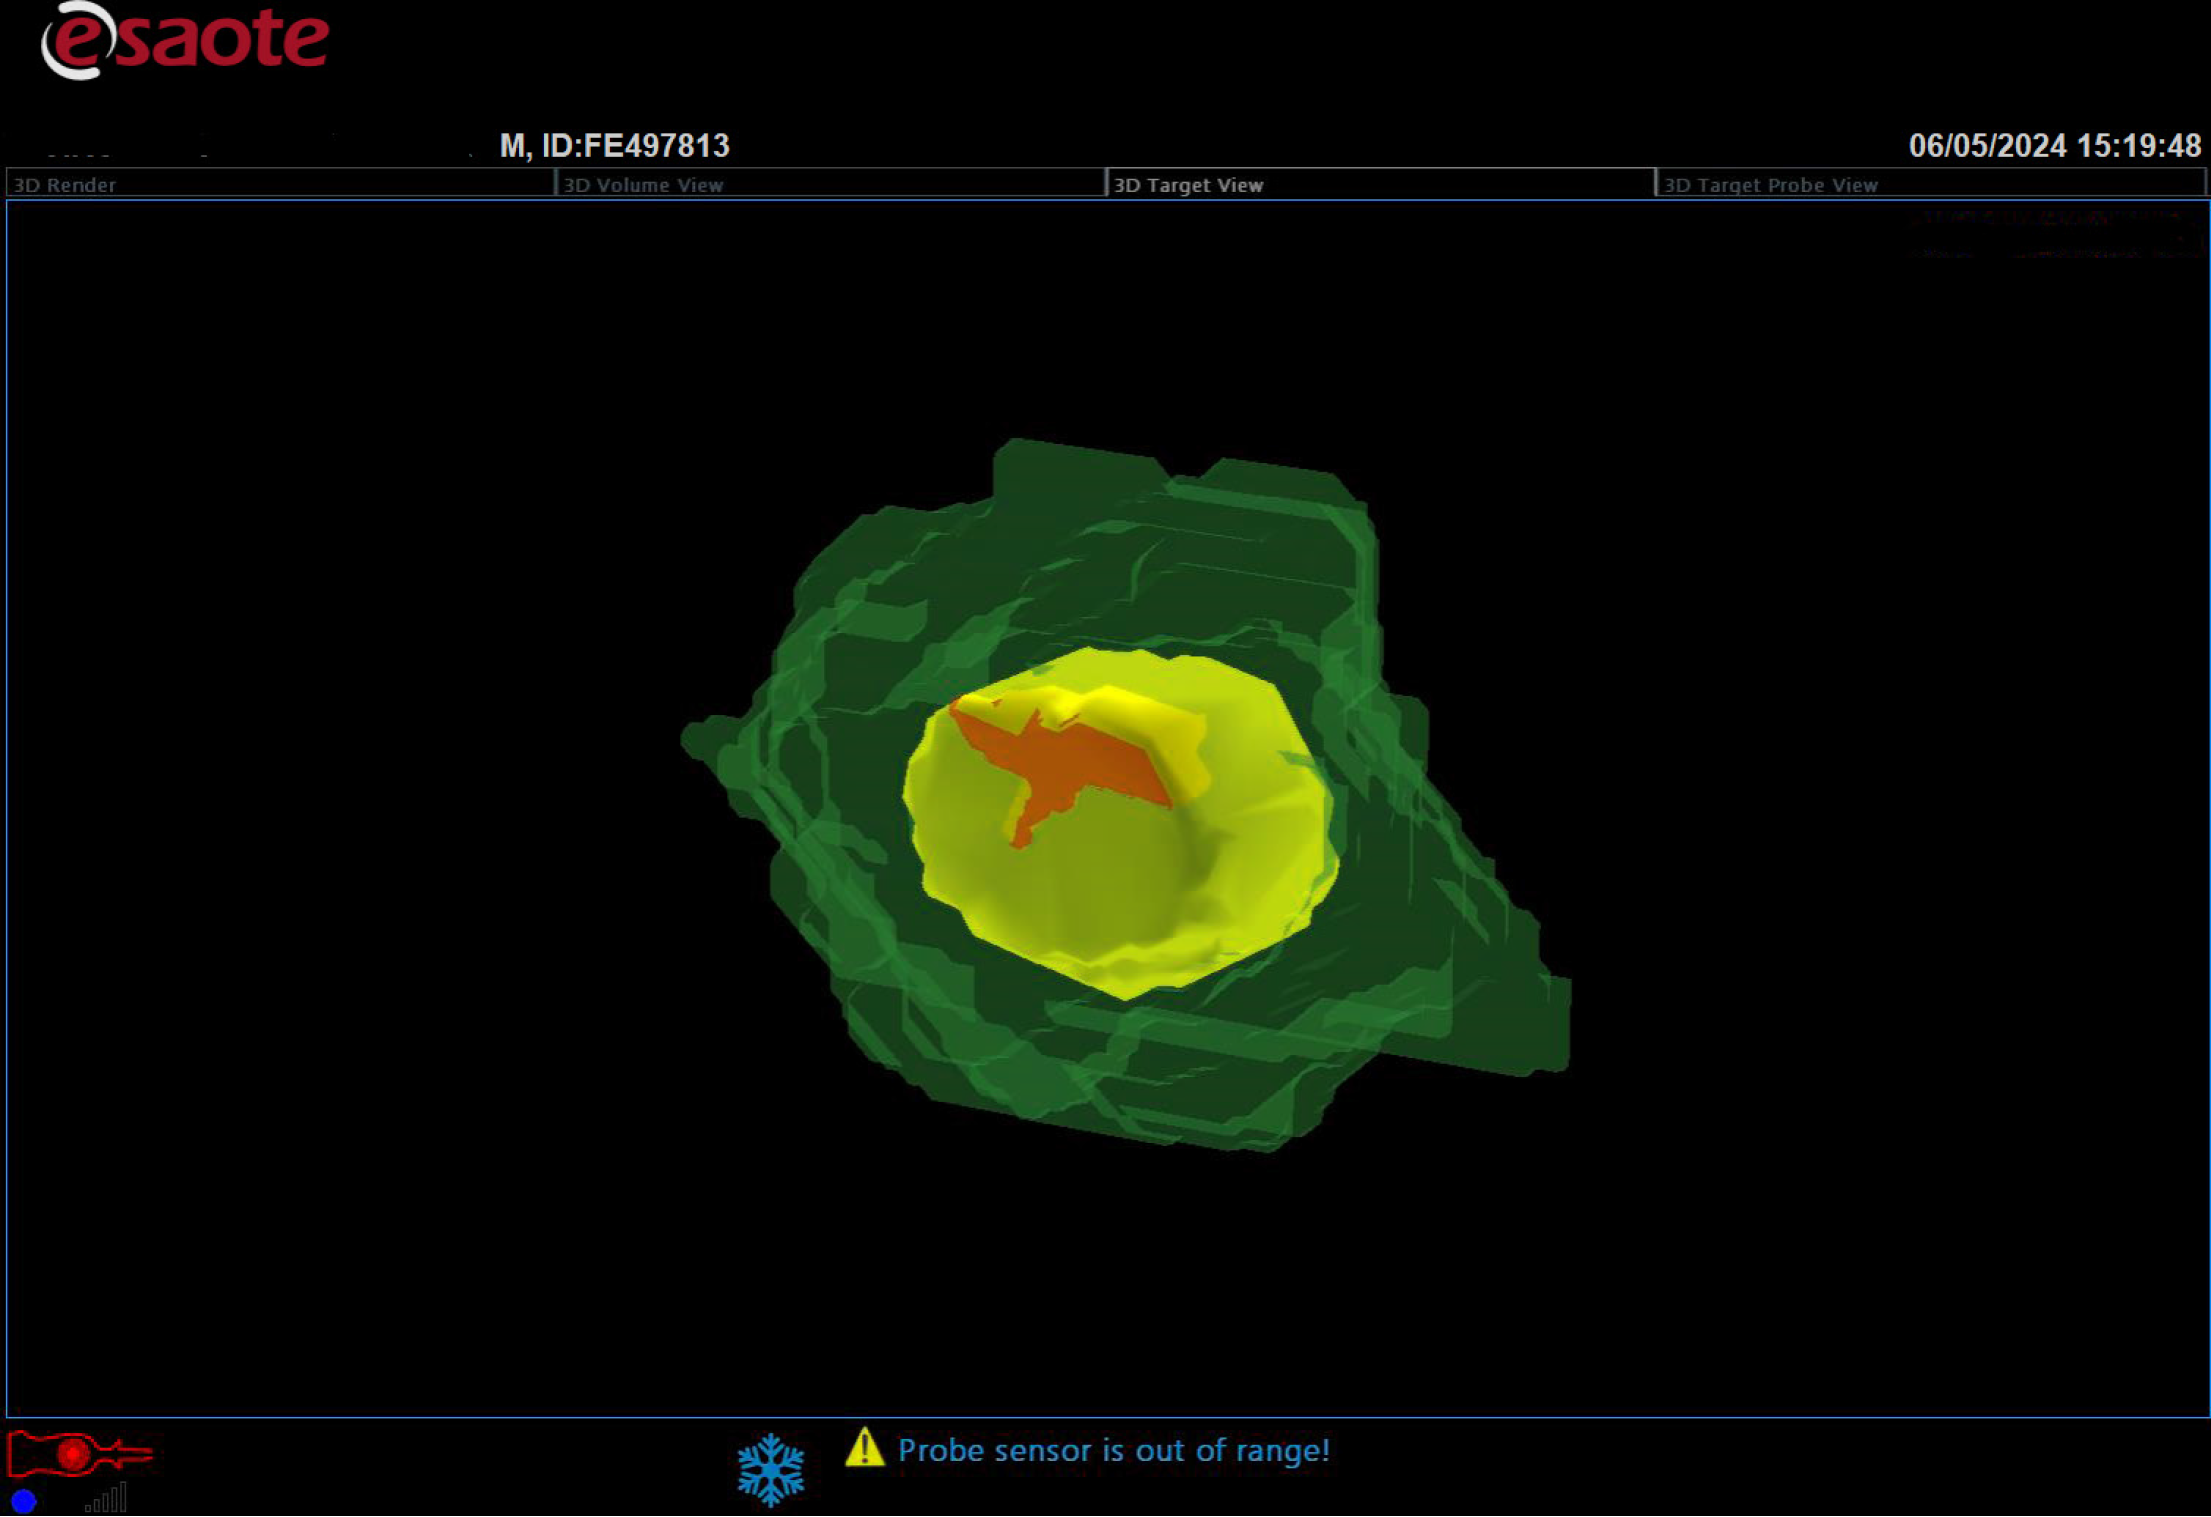
Figure 8
Three-dimensional reconstruction of the ablation result showed the necrotic volume (deep green), planned safety margin (yellow), completely necrotic lesion (light green), and planned safety margin outside of necrosis volume (red).
- Citation: Tombesi P, Cutini A, Grasso V, Di Vece F, Politti U, Capatti E, Labb F, Petaccia S, Sartori S. Past, present, and future perspectives of ultrasound-guided ablation of liver tumors: Where could artificial intelligence lead interventional oncology? Artif Intell Cancer 2024; 5(1): 96690
- URL: https://www.wjgnet.com/2644-3228/full/v5/i1/96690.htm
- DOI: https://dx.doi.org/10.35713/aic.v5.i1.96690


