Copyright
©The Author(s) 2021.
World J Meta-Anal. Dec 28, 2021; 9(6): 585-597
Published online Dec 28, 2021. doi: 10.13105/wjma.v9.i6.585
Published online Dec 28, 2021. doi: 10.13105/wjma.v9.i6.585
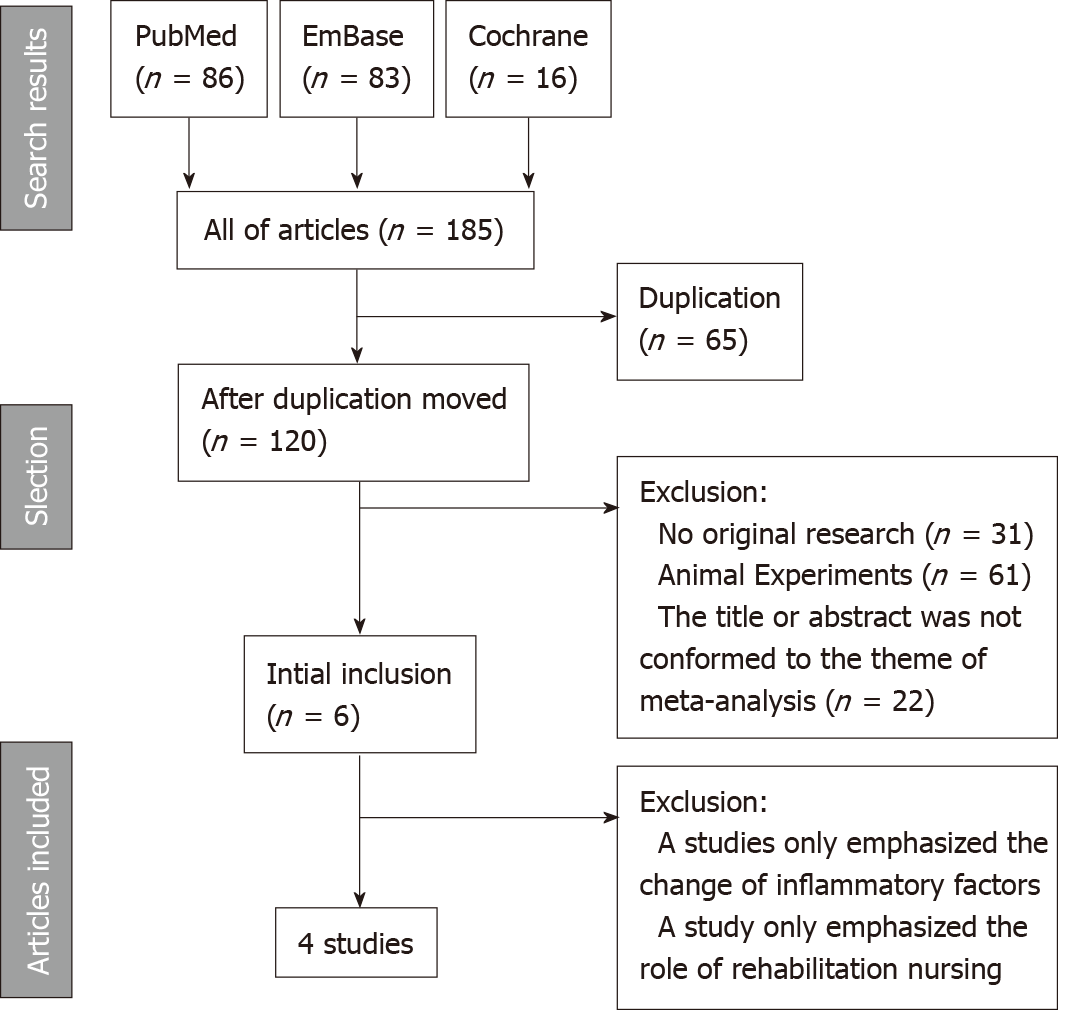
Figure 1 Process of study screening.
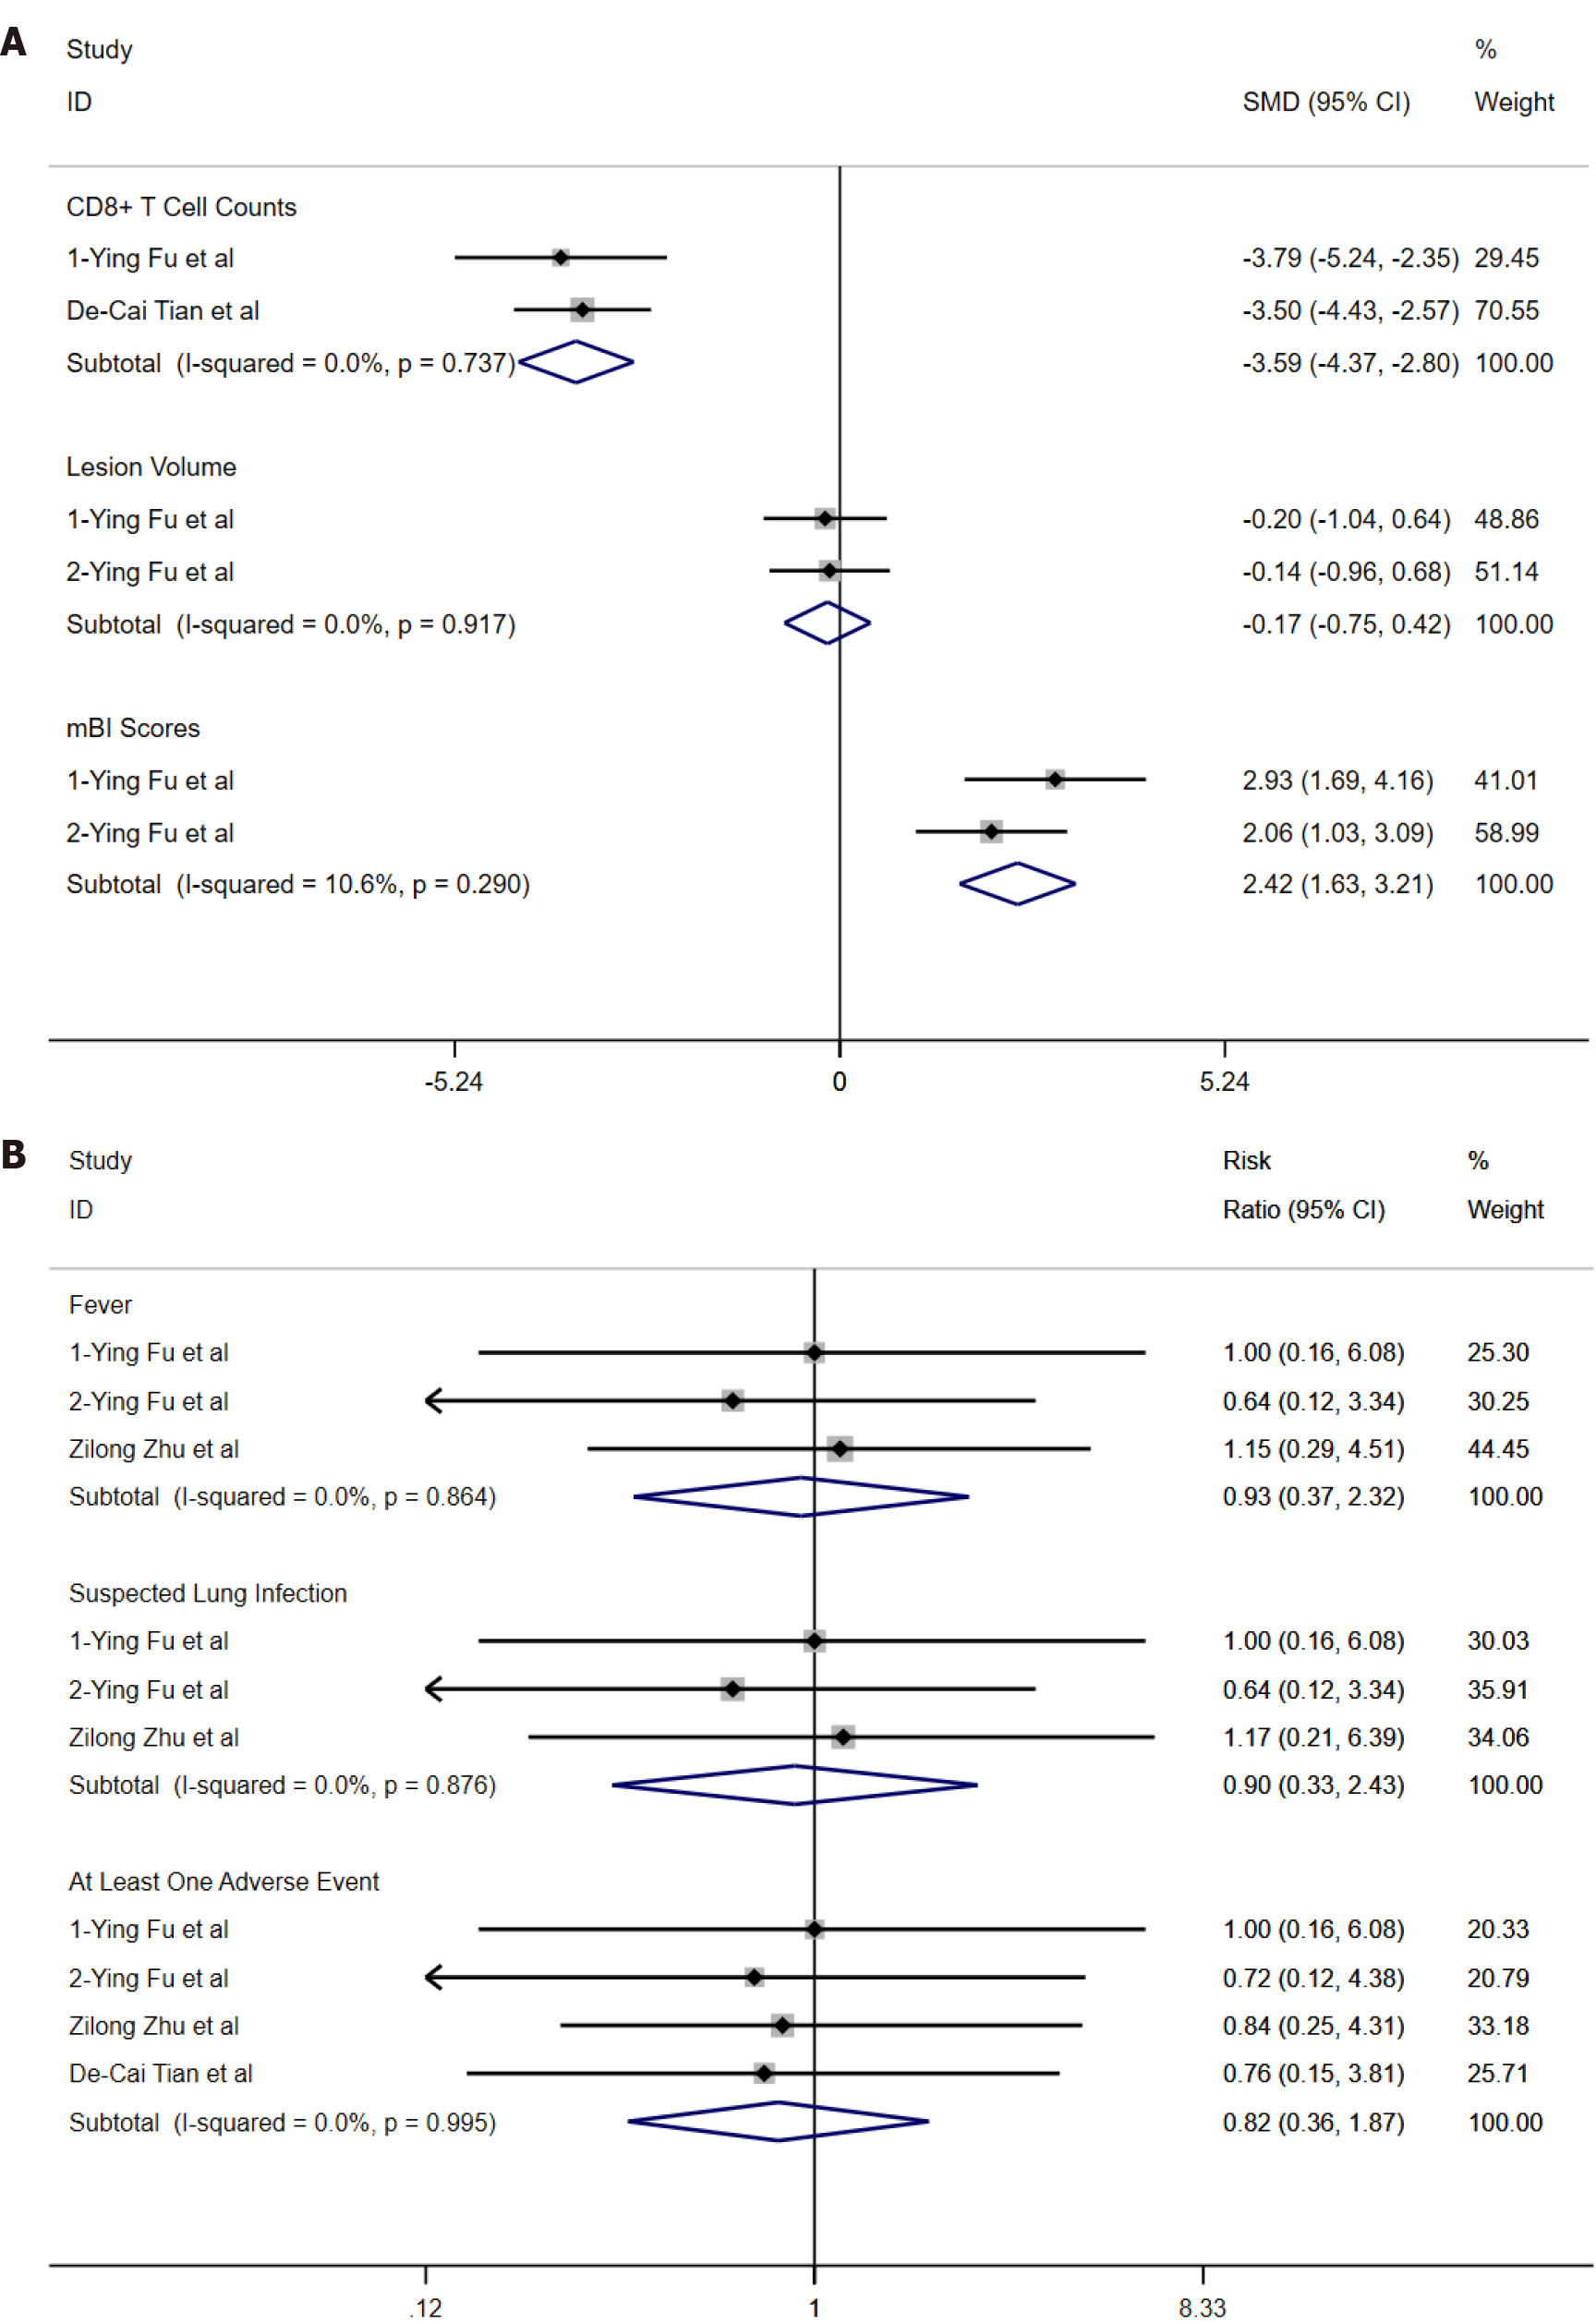
Figure 3 Forest plots of overall standard mean difference and pooled risk ratio.
A: Overall standard mean difference of T-lymphocytes with cluster of differentiation 8 expression/infarction or hematoma volume/modified Barthel index scores; B: Pooled risk ratio of fever/suspected lung infection/adverse events occurring at least once. 1-Ying Fu et al”[15] and 2-Ying Fu et al[16] represent two different references. mBI scores: Modified Barthel index scores. RR: Risk ratio; CD8+ T cell: T-lymphocytes with cluster of differentiation 8 expression; Lesion volume: Infarction or hematoma volume; SMD: Standard mean difference.
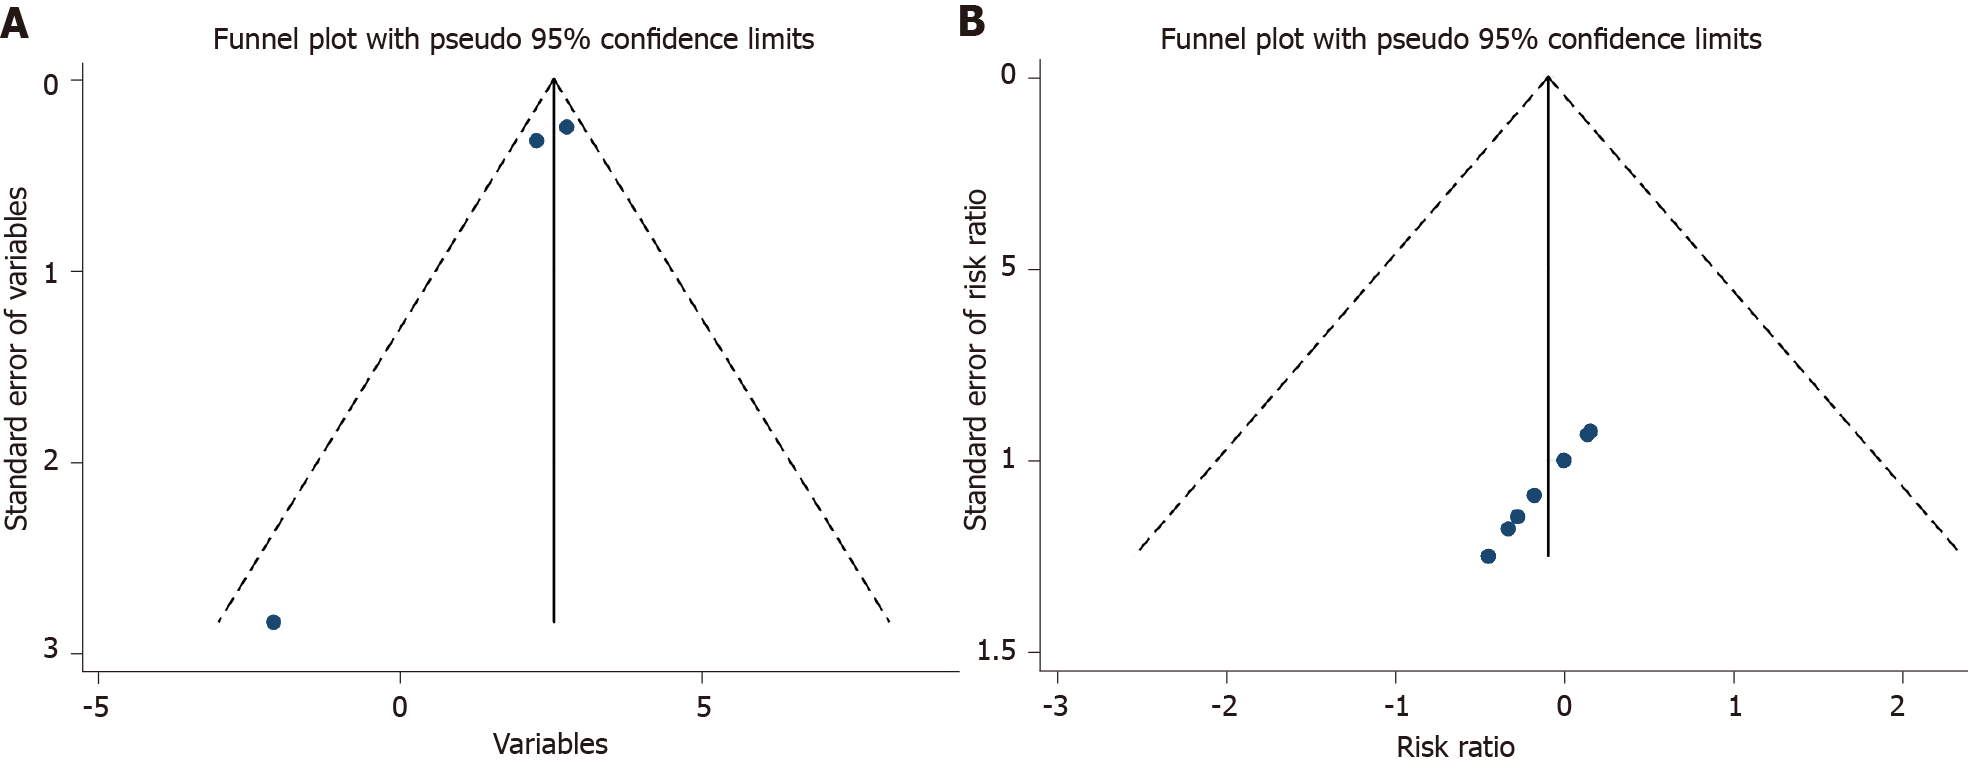
Figure 4 Funnel plots of publication bias.
A: Funnel plot of variables used to acquire overall standard mean difference; B: Funnel diagram of risk ratio.
- Citation: Zhao K, Guo Y, Yang MF, Zhang Q. Efficacy and safety of fingolimod in stroke: A systemic review and meta-analysis. World J Meta-Anal 2021; 9(6): 585-597
- URL: https://www.wjgnet.com/2308-3840/full/v9/i6/585.htm
- DOI: https://dx.doi.org/10.13105/wjma.v9.i6.585


