Copyright
©The Author(s) 2021.
World J Meta-Anal. Dec 28, 2021; 9(6): 557-567
Published online Dec 28, 2021. doi: 10.13105/wjma.v9.i6.557
Published online Dec 28, 2021. doi: 10.13105/wjma.v9.i6.557
Figure 1 The flowchart of screening the eligible studies.
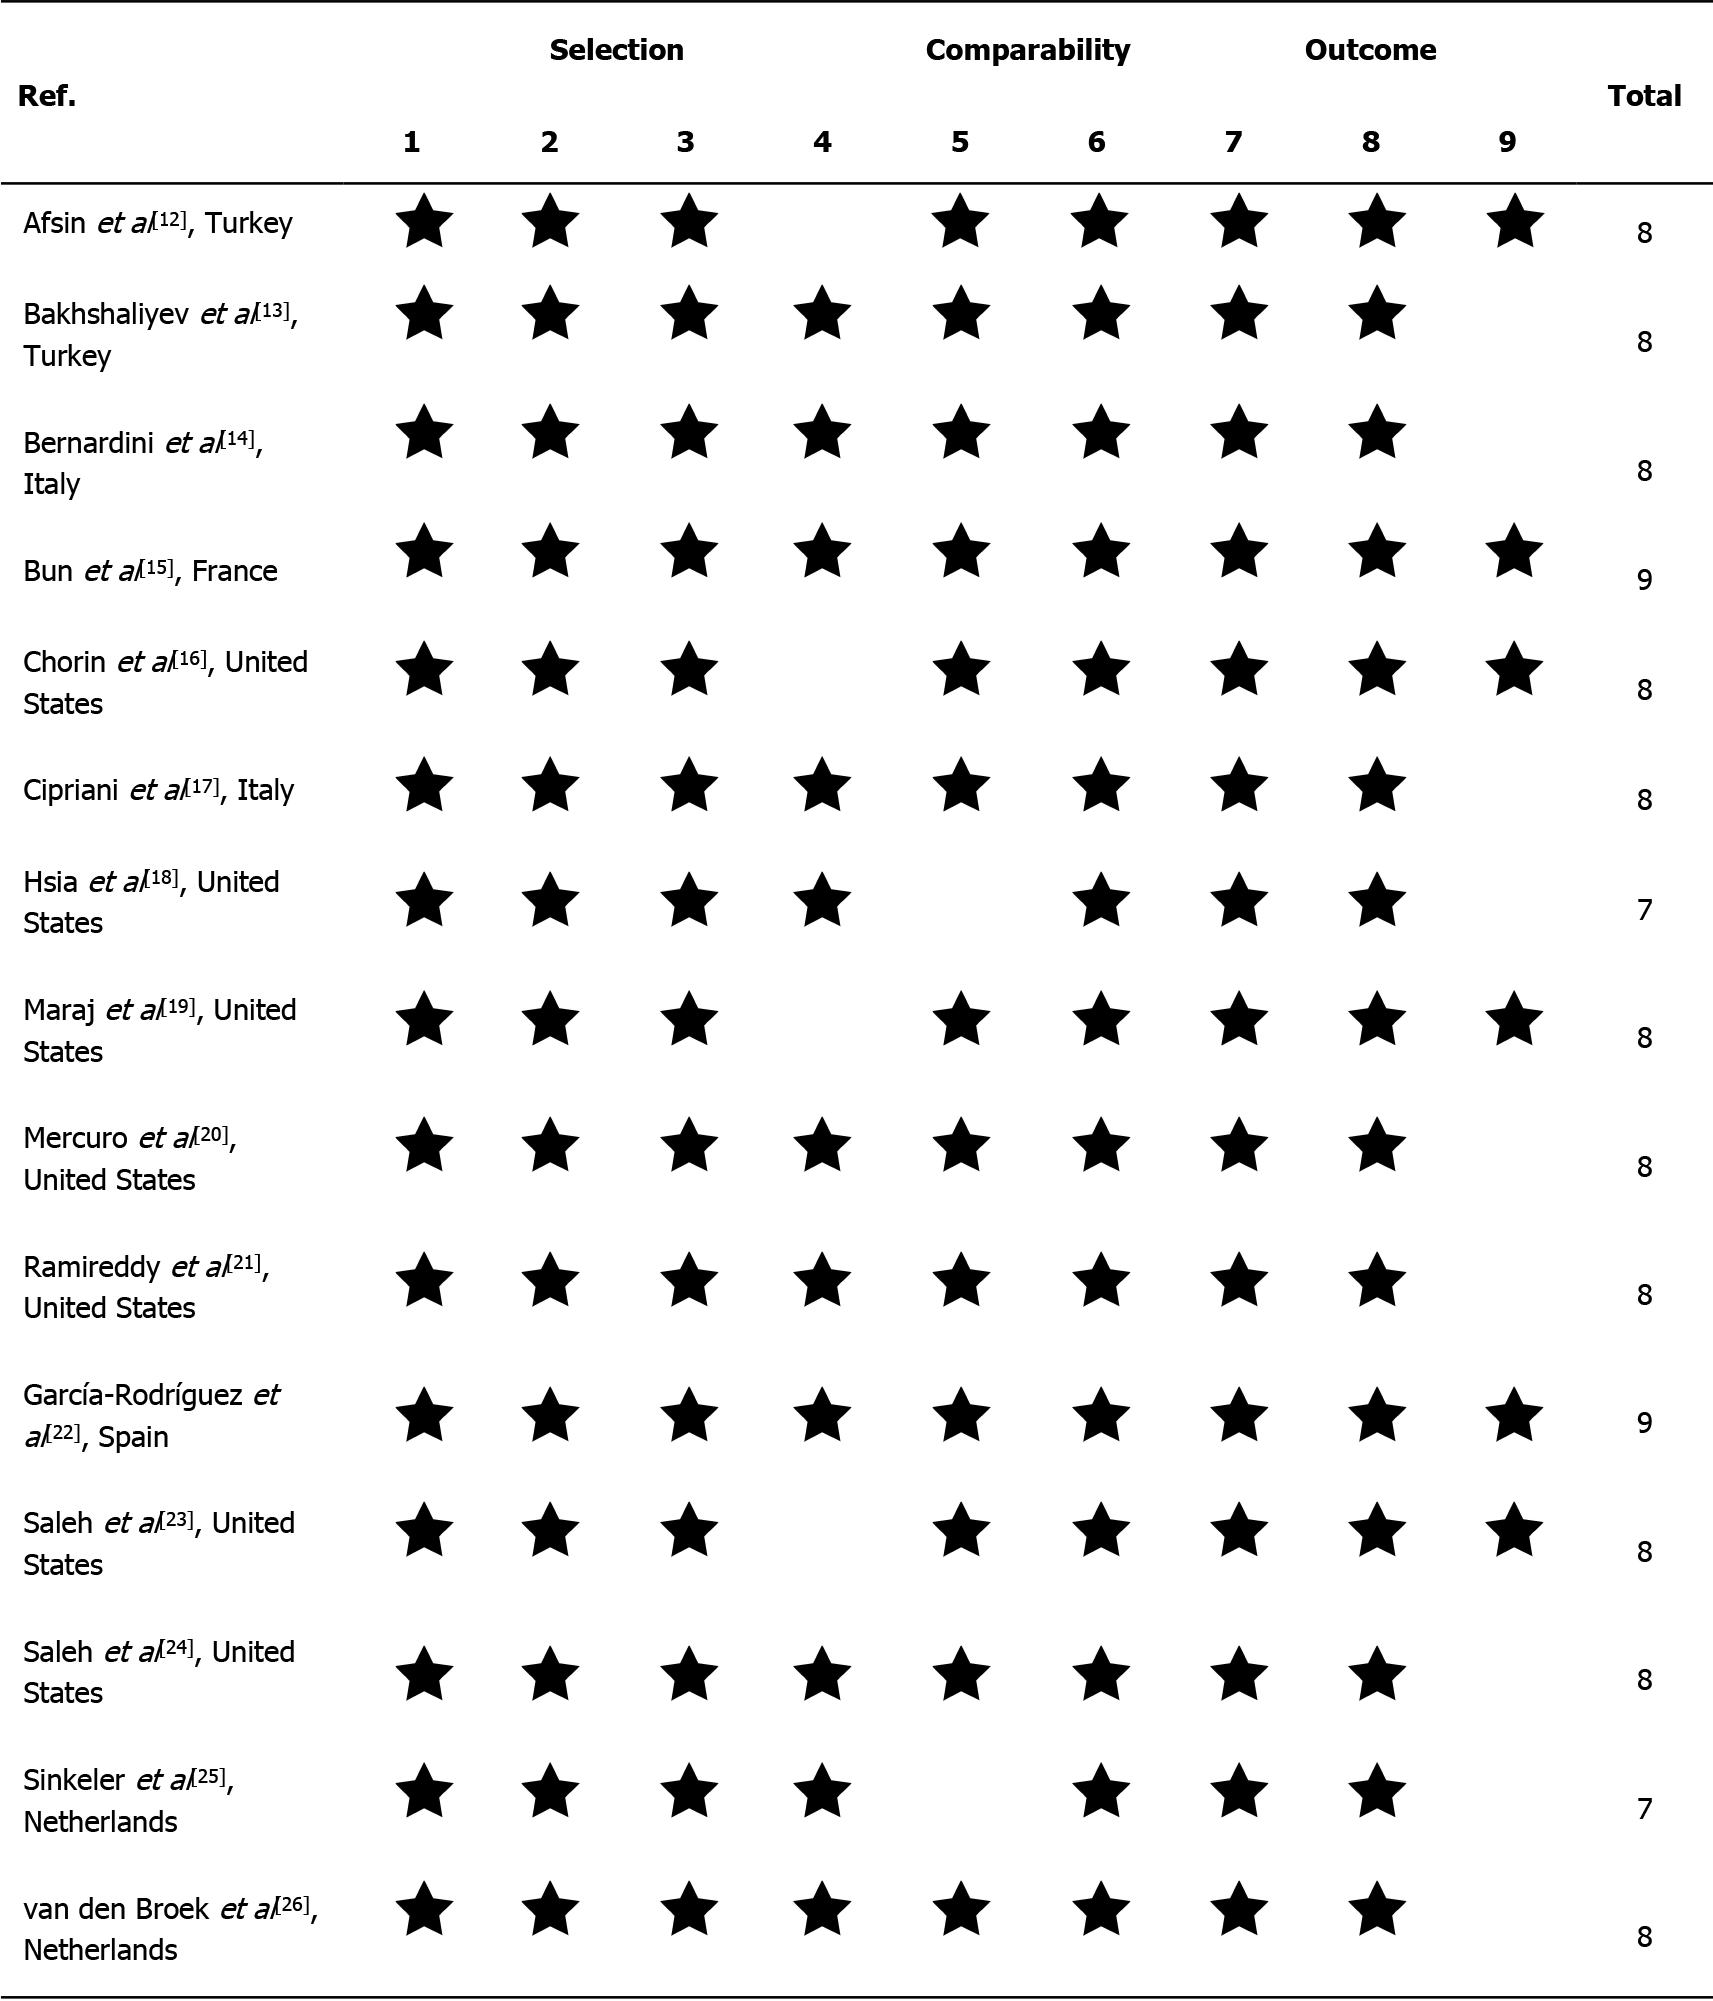
Figure 2 The quality assessment of the studies according to the nine-star Newcastle-Ottawa Scale scoring system.
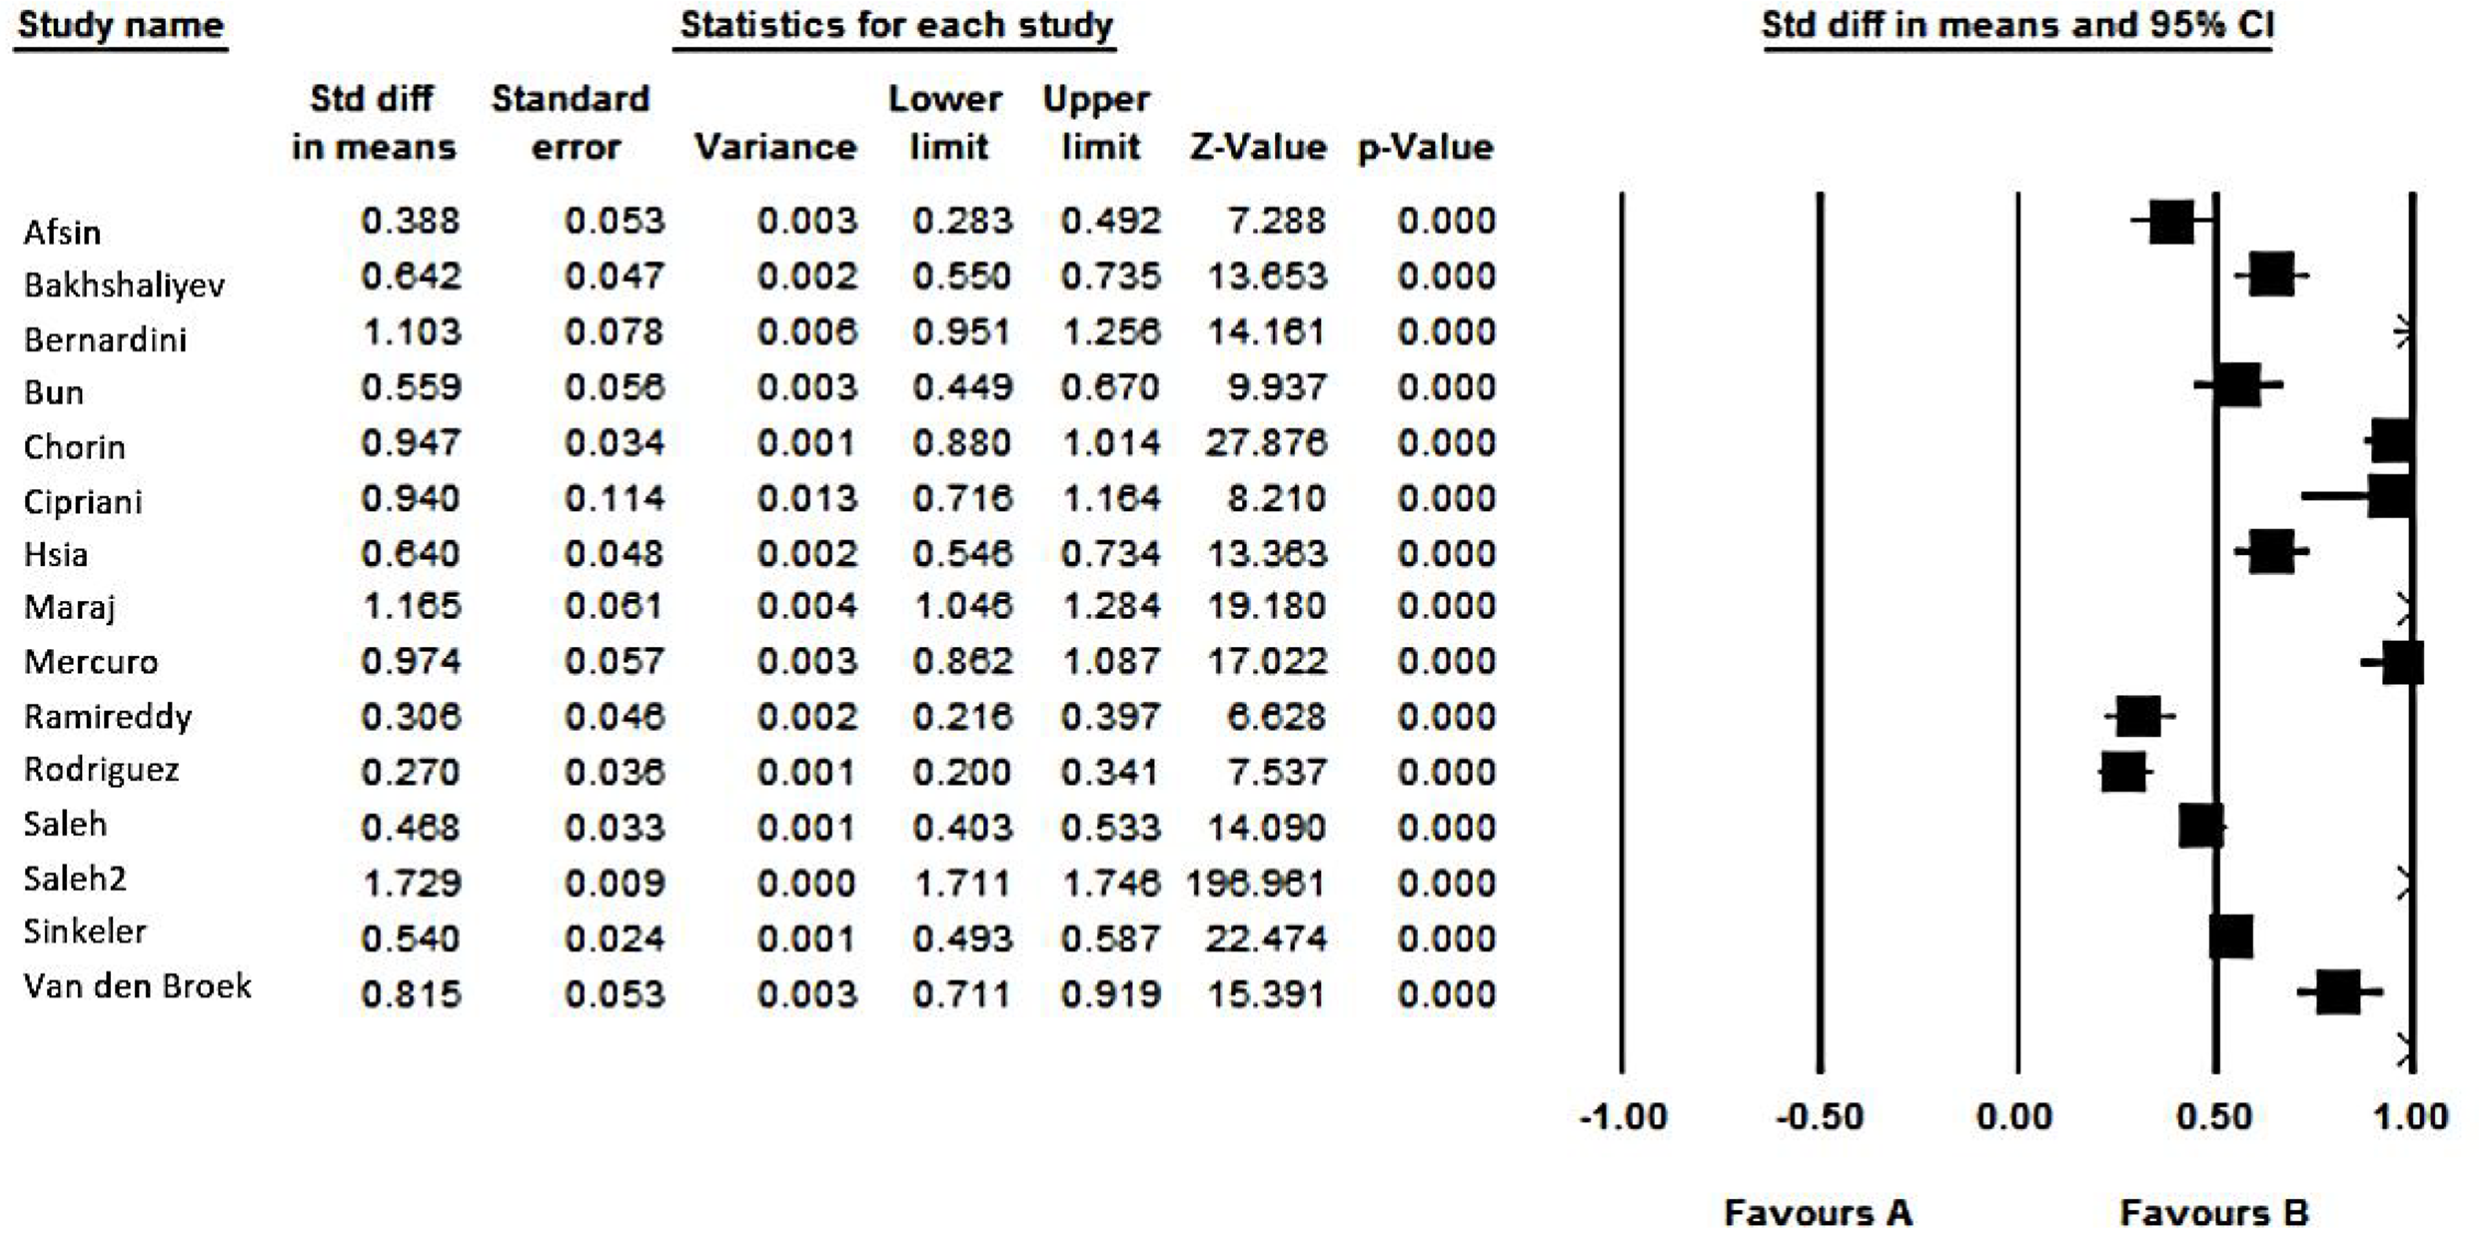
Figure 3 The pooled analysis on the difference in mean corrected QT after treatment compared to the baseline.
CI: Confidence interval.
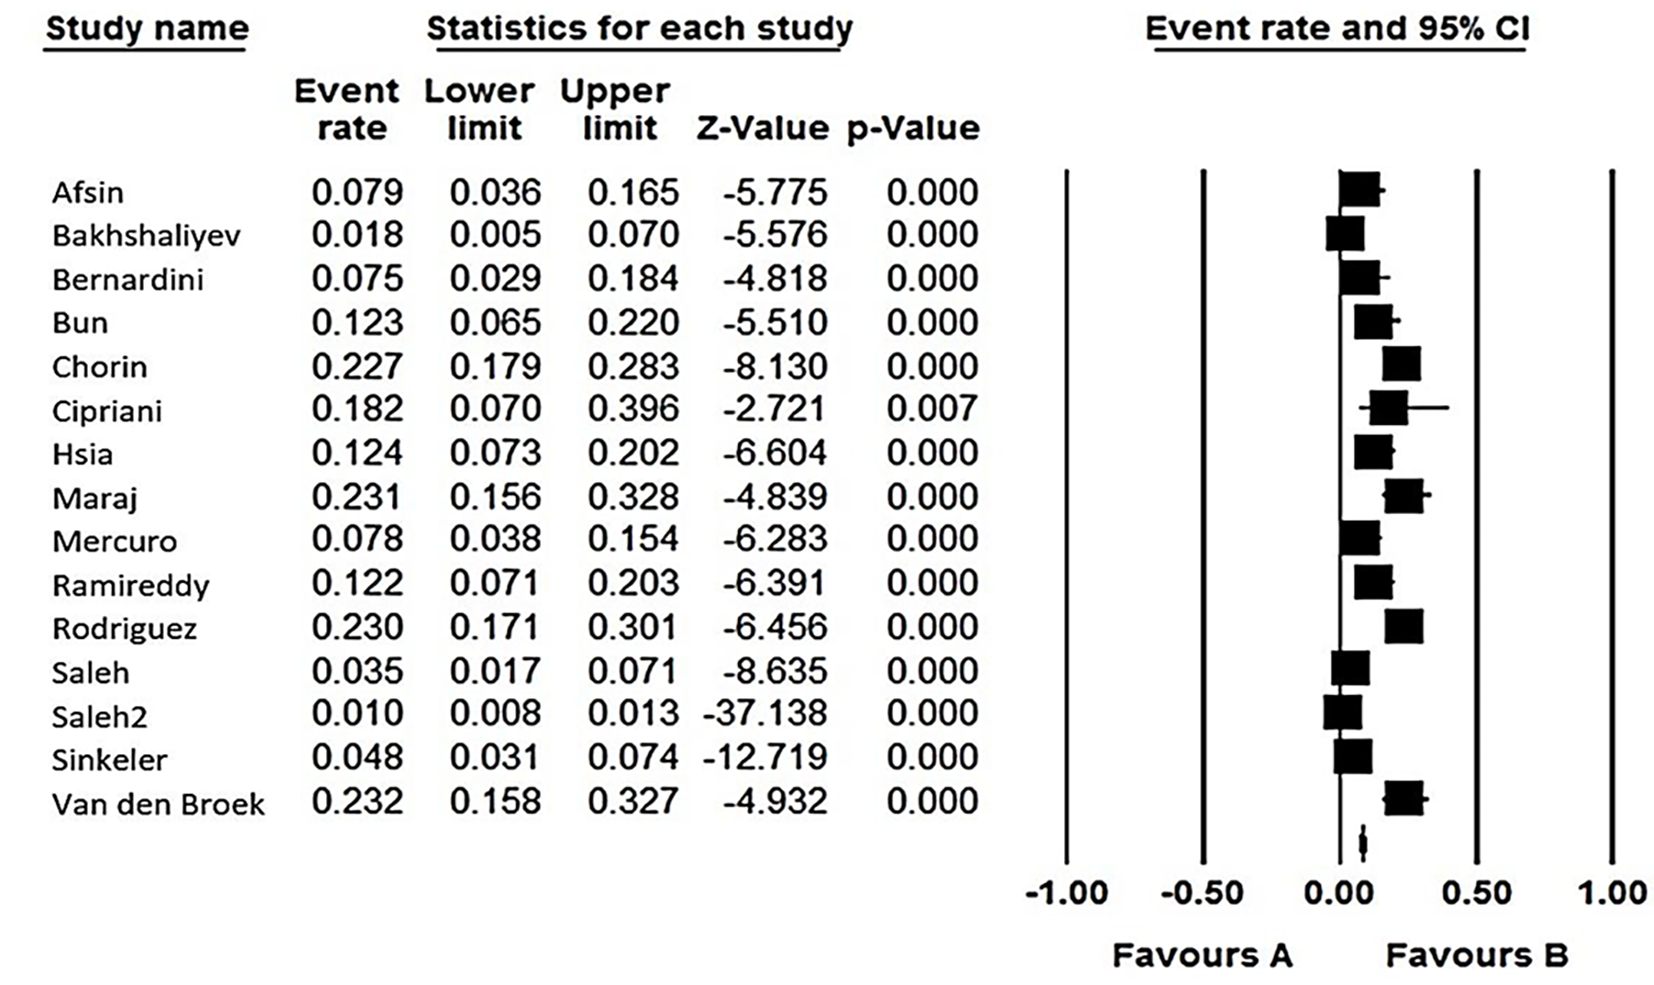
Figure 4 The pooled prevalence of corrected QT prolongation after treatment.
CI: Confidence interval.
- Citation: Ashraf H, Ghafouri P, Kazemian S, Soleimani A, Sadat Naseri A, Karbalai S, Kazemi Saeid A. Hydroxychloroquine alone or in combination with azithromycin and corrected QT prolongation in COVID-19 patients: A systematic review. World J Meta-Anal 2021; 9(6): 557-567
- URL: https://www.wjgnet.com/2308-3840/full/v9/i6/557.htm
- DOI: https://dx.doi.org/10.13105/wjma.v9.i6.557


