Copyright
©The Author(s) 2020.
World J Meta-Anal. Aug 28, 2020; 8(4): 320-344
Published online Aug 28, 2020. doi: 10.13105/wjma.v8.i4.320
Published online Aug 28, 2020. doi: 10.13105/wjma.v8.i4.320
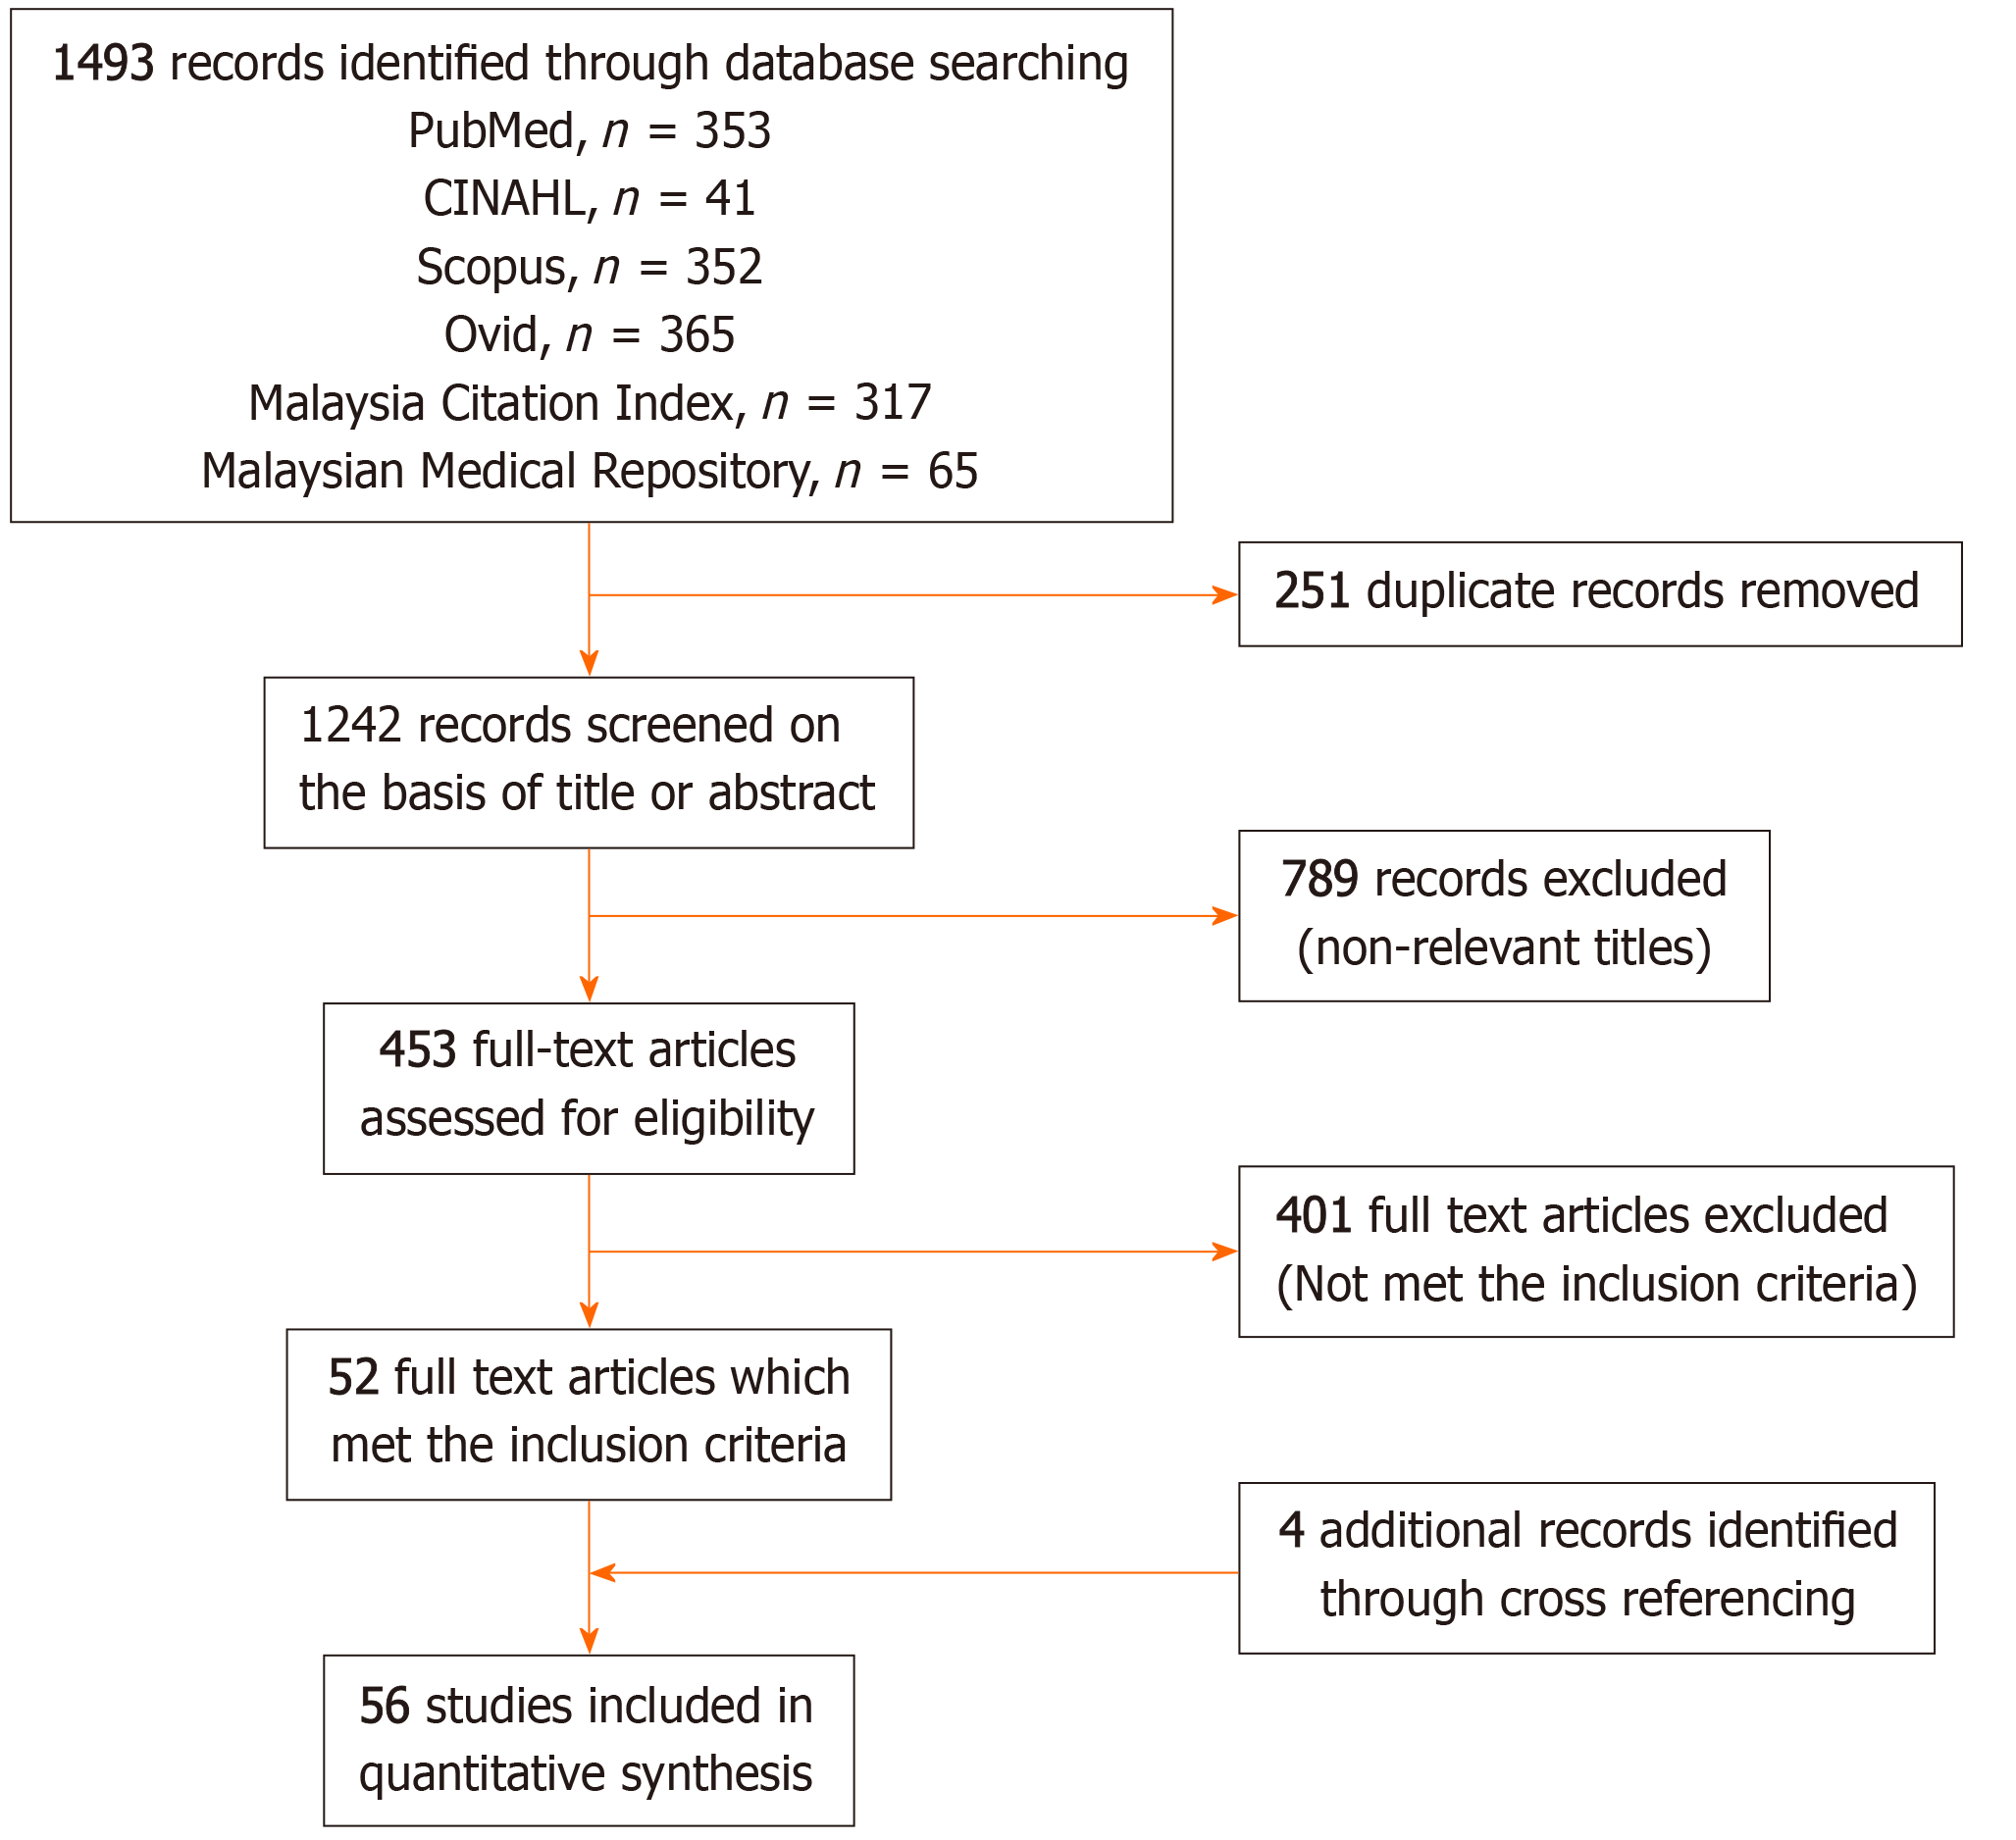
Figure 1 Preferred reporting items for systematic review and meta-analysis flow diagram of the literature screening process.
Numbers indicate the article count retained at each step of the process.
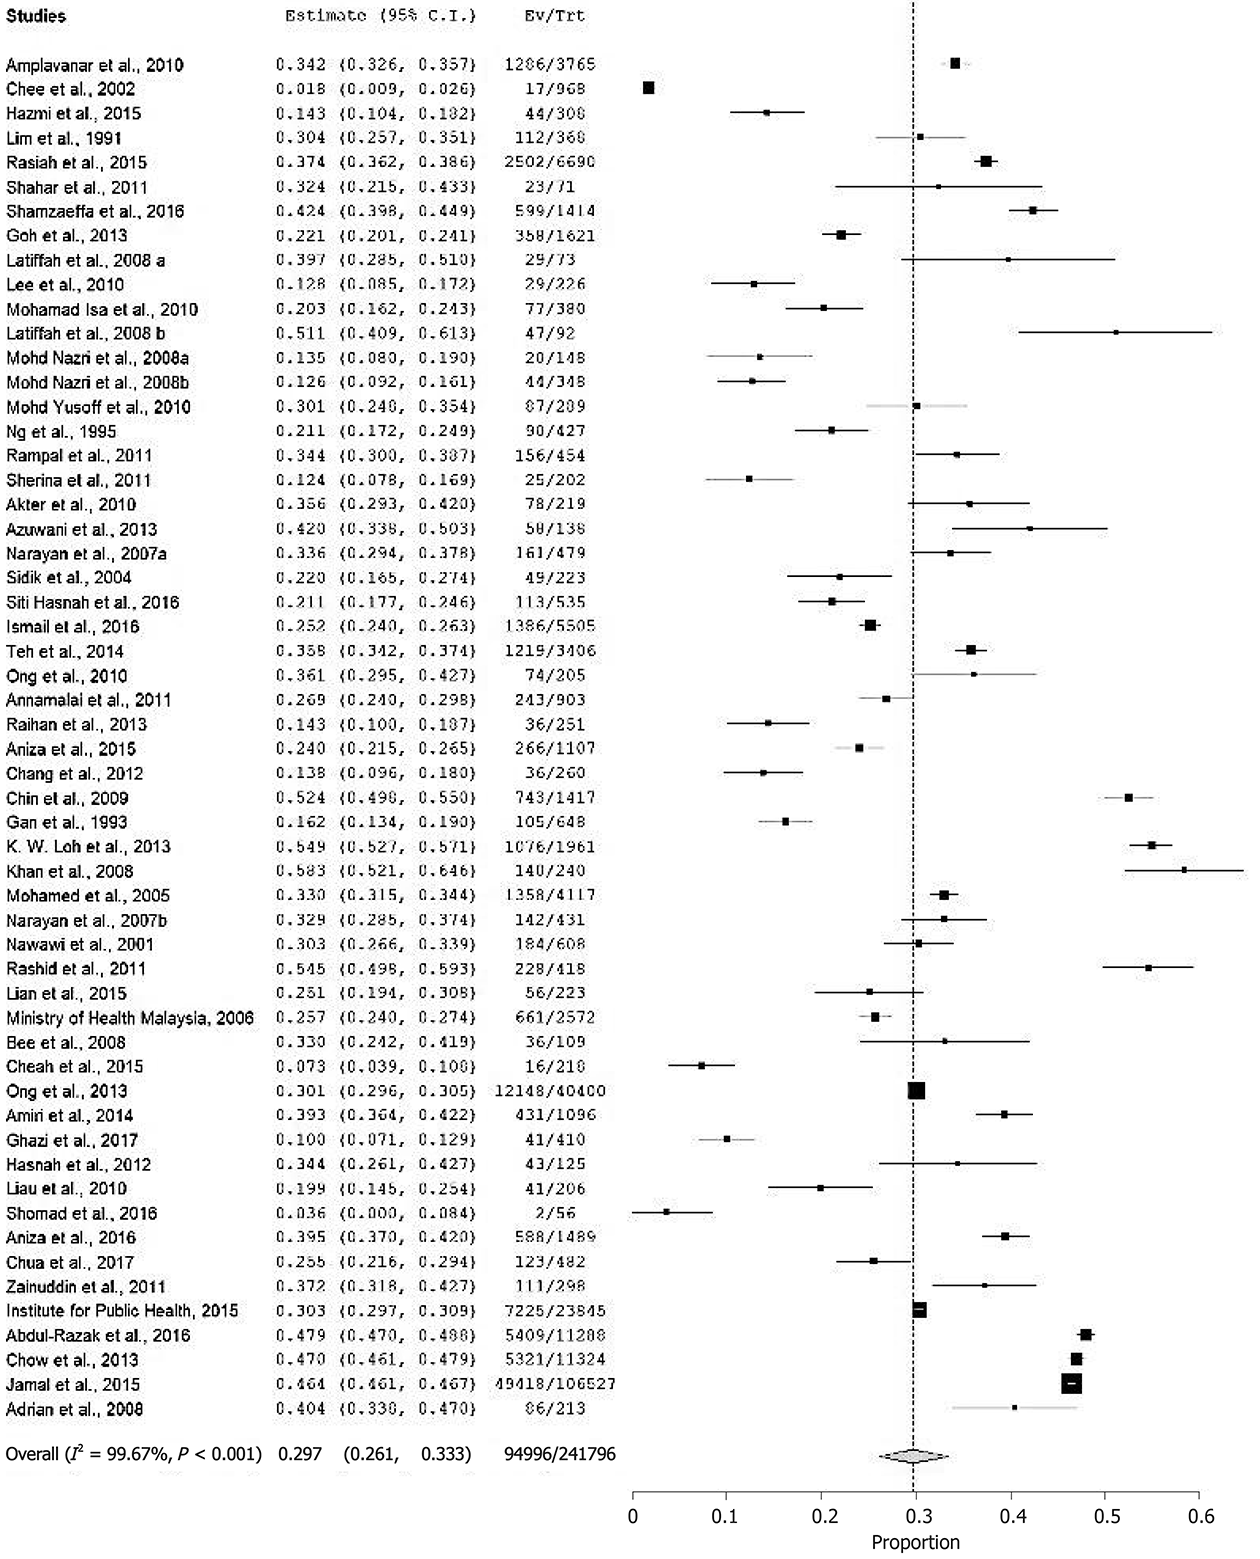
Figure 2 Pooled prevalence of hypertension.
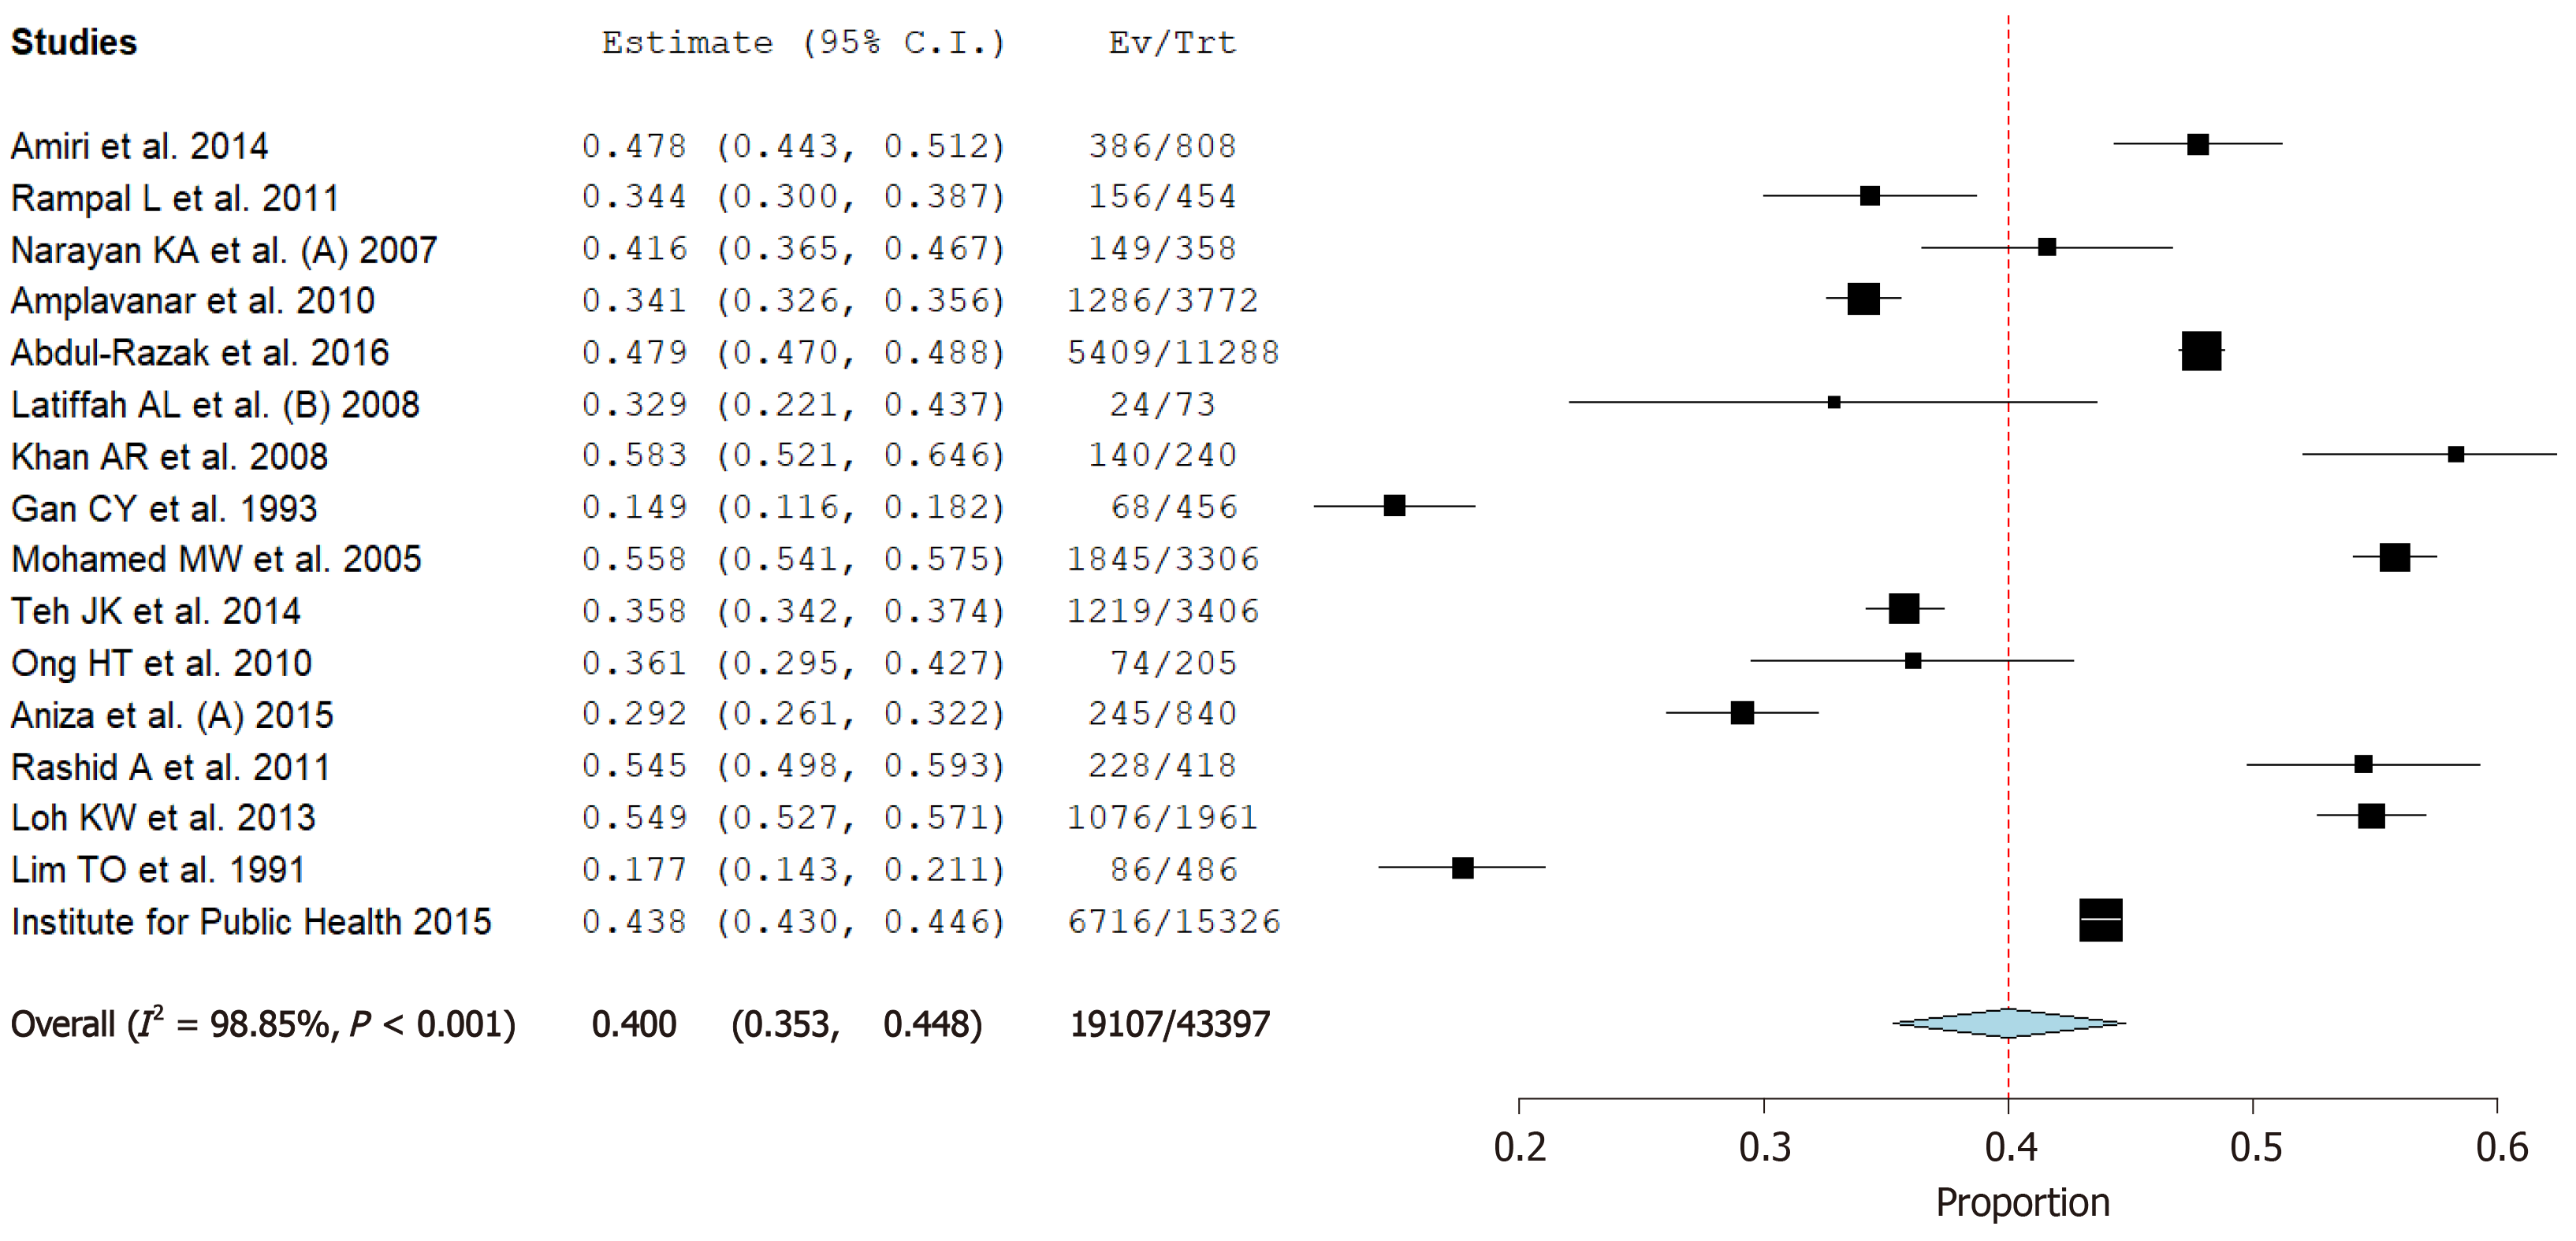
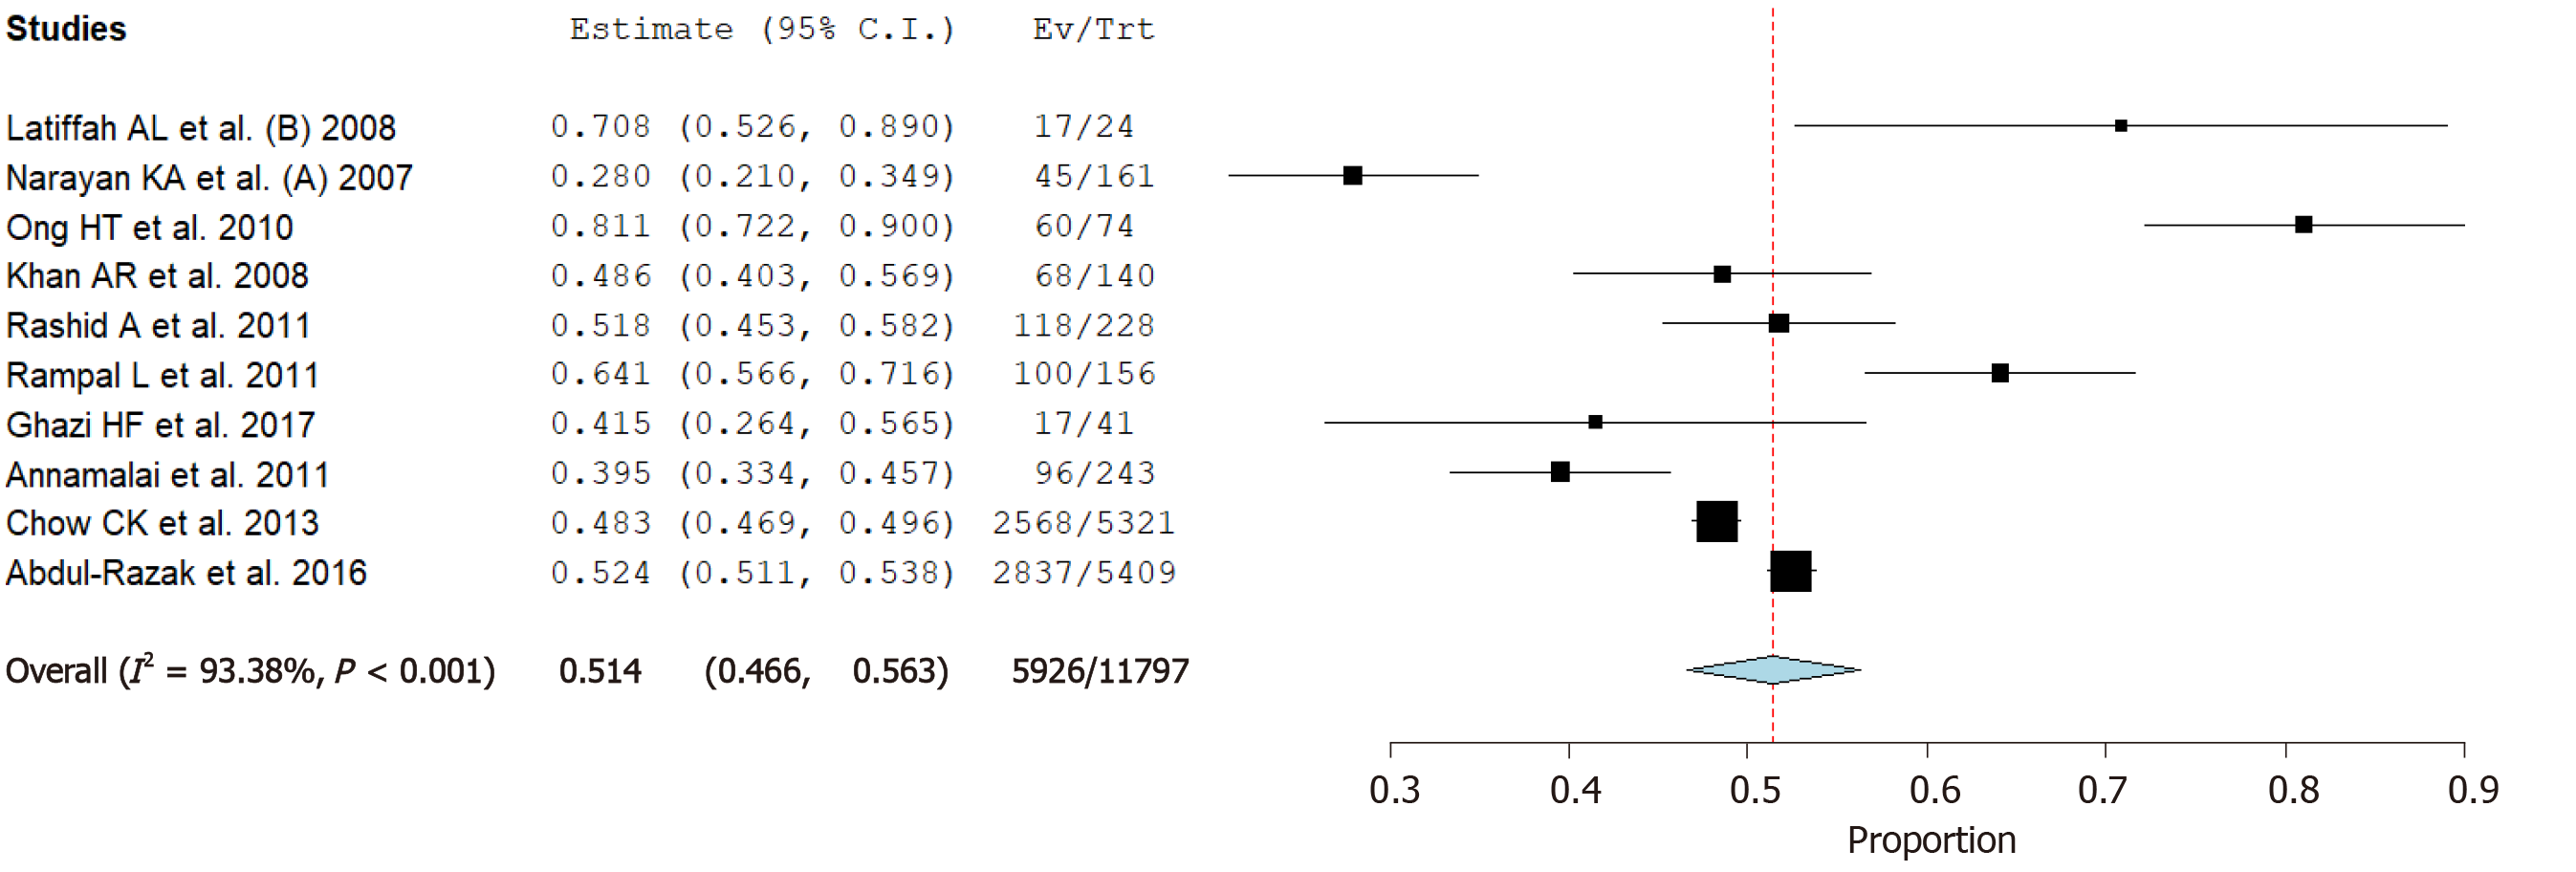
Figure 3 Pooled prevalence of hypertension in adults aged ≥ 30 years.
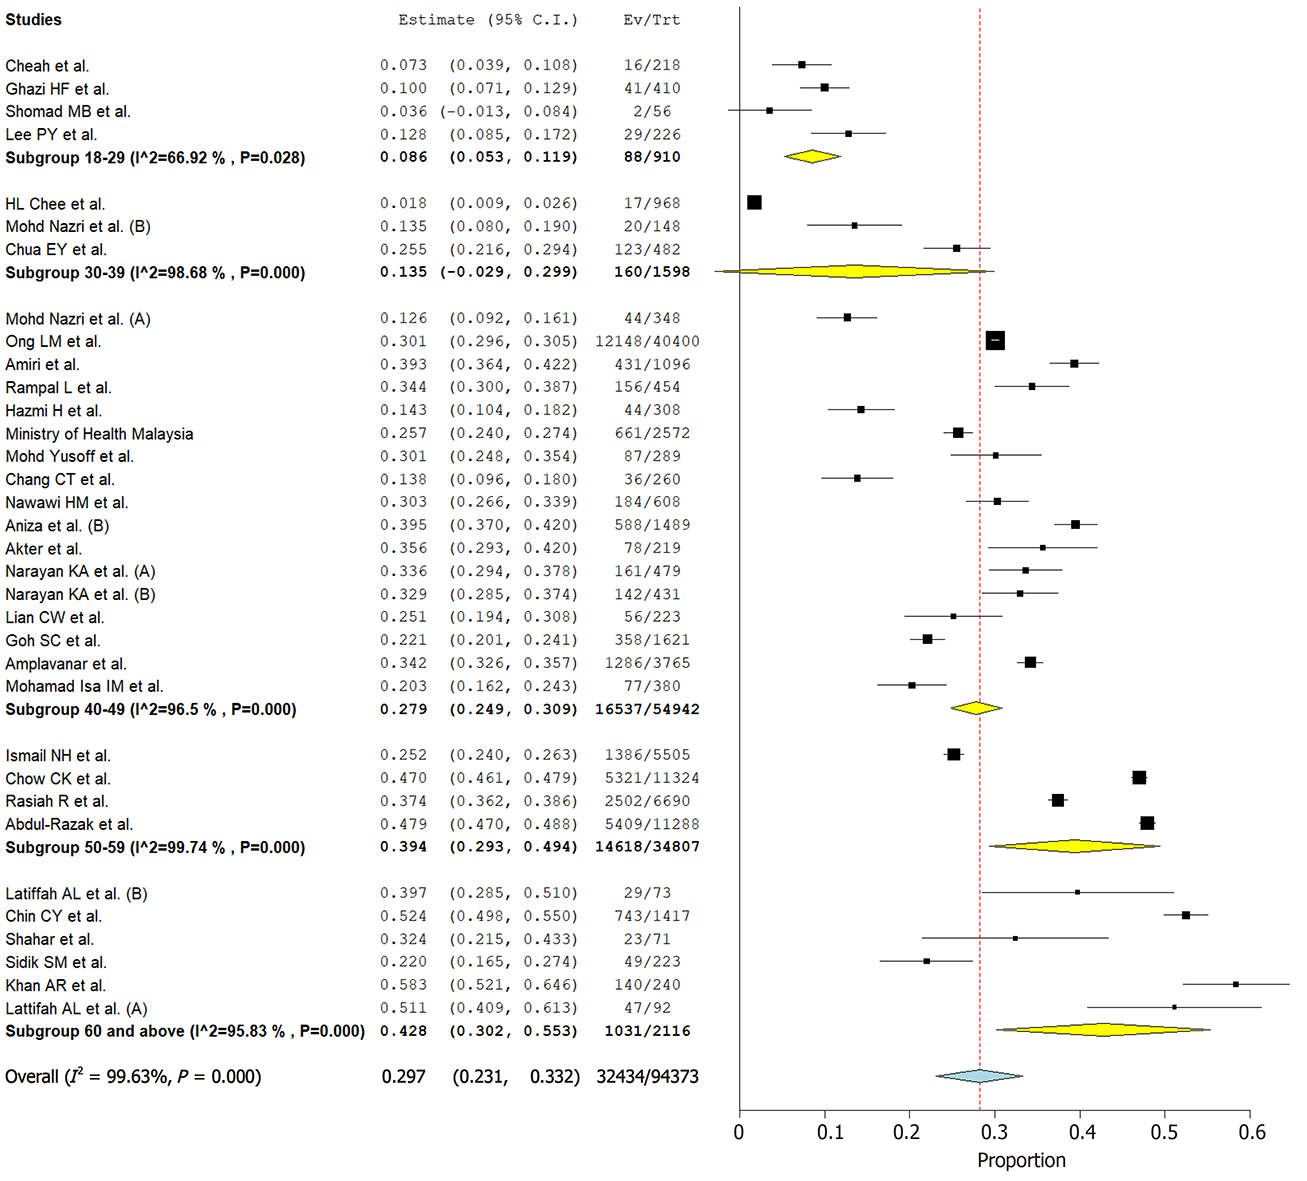
Figure 4 Pooled prevalence of hypertension subanalysis by age groups.
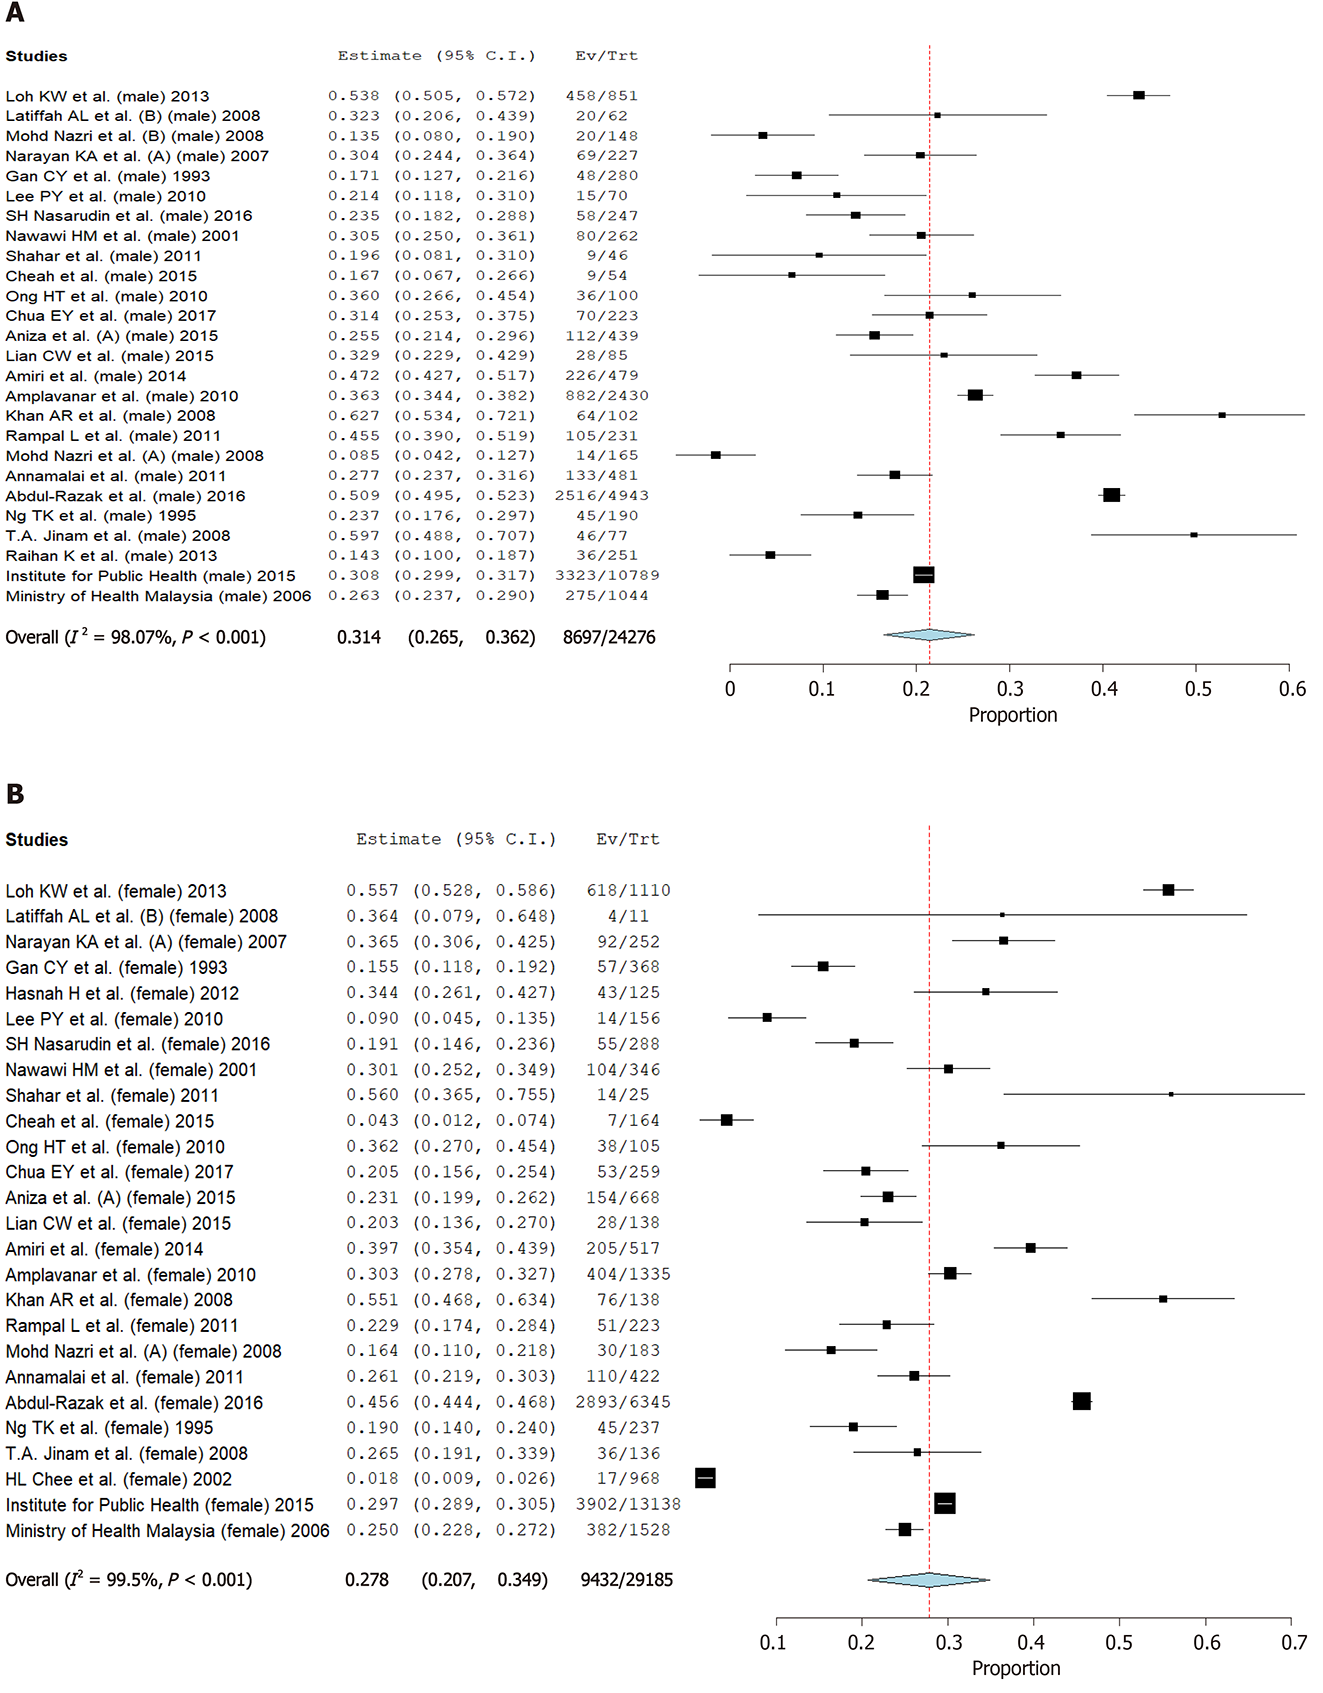
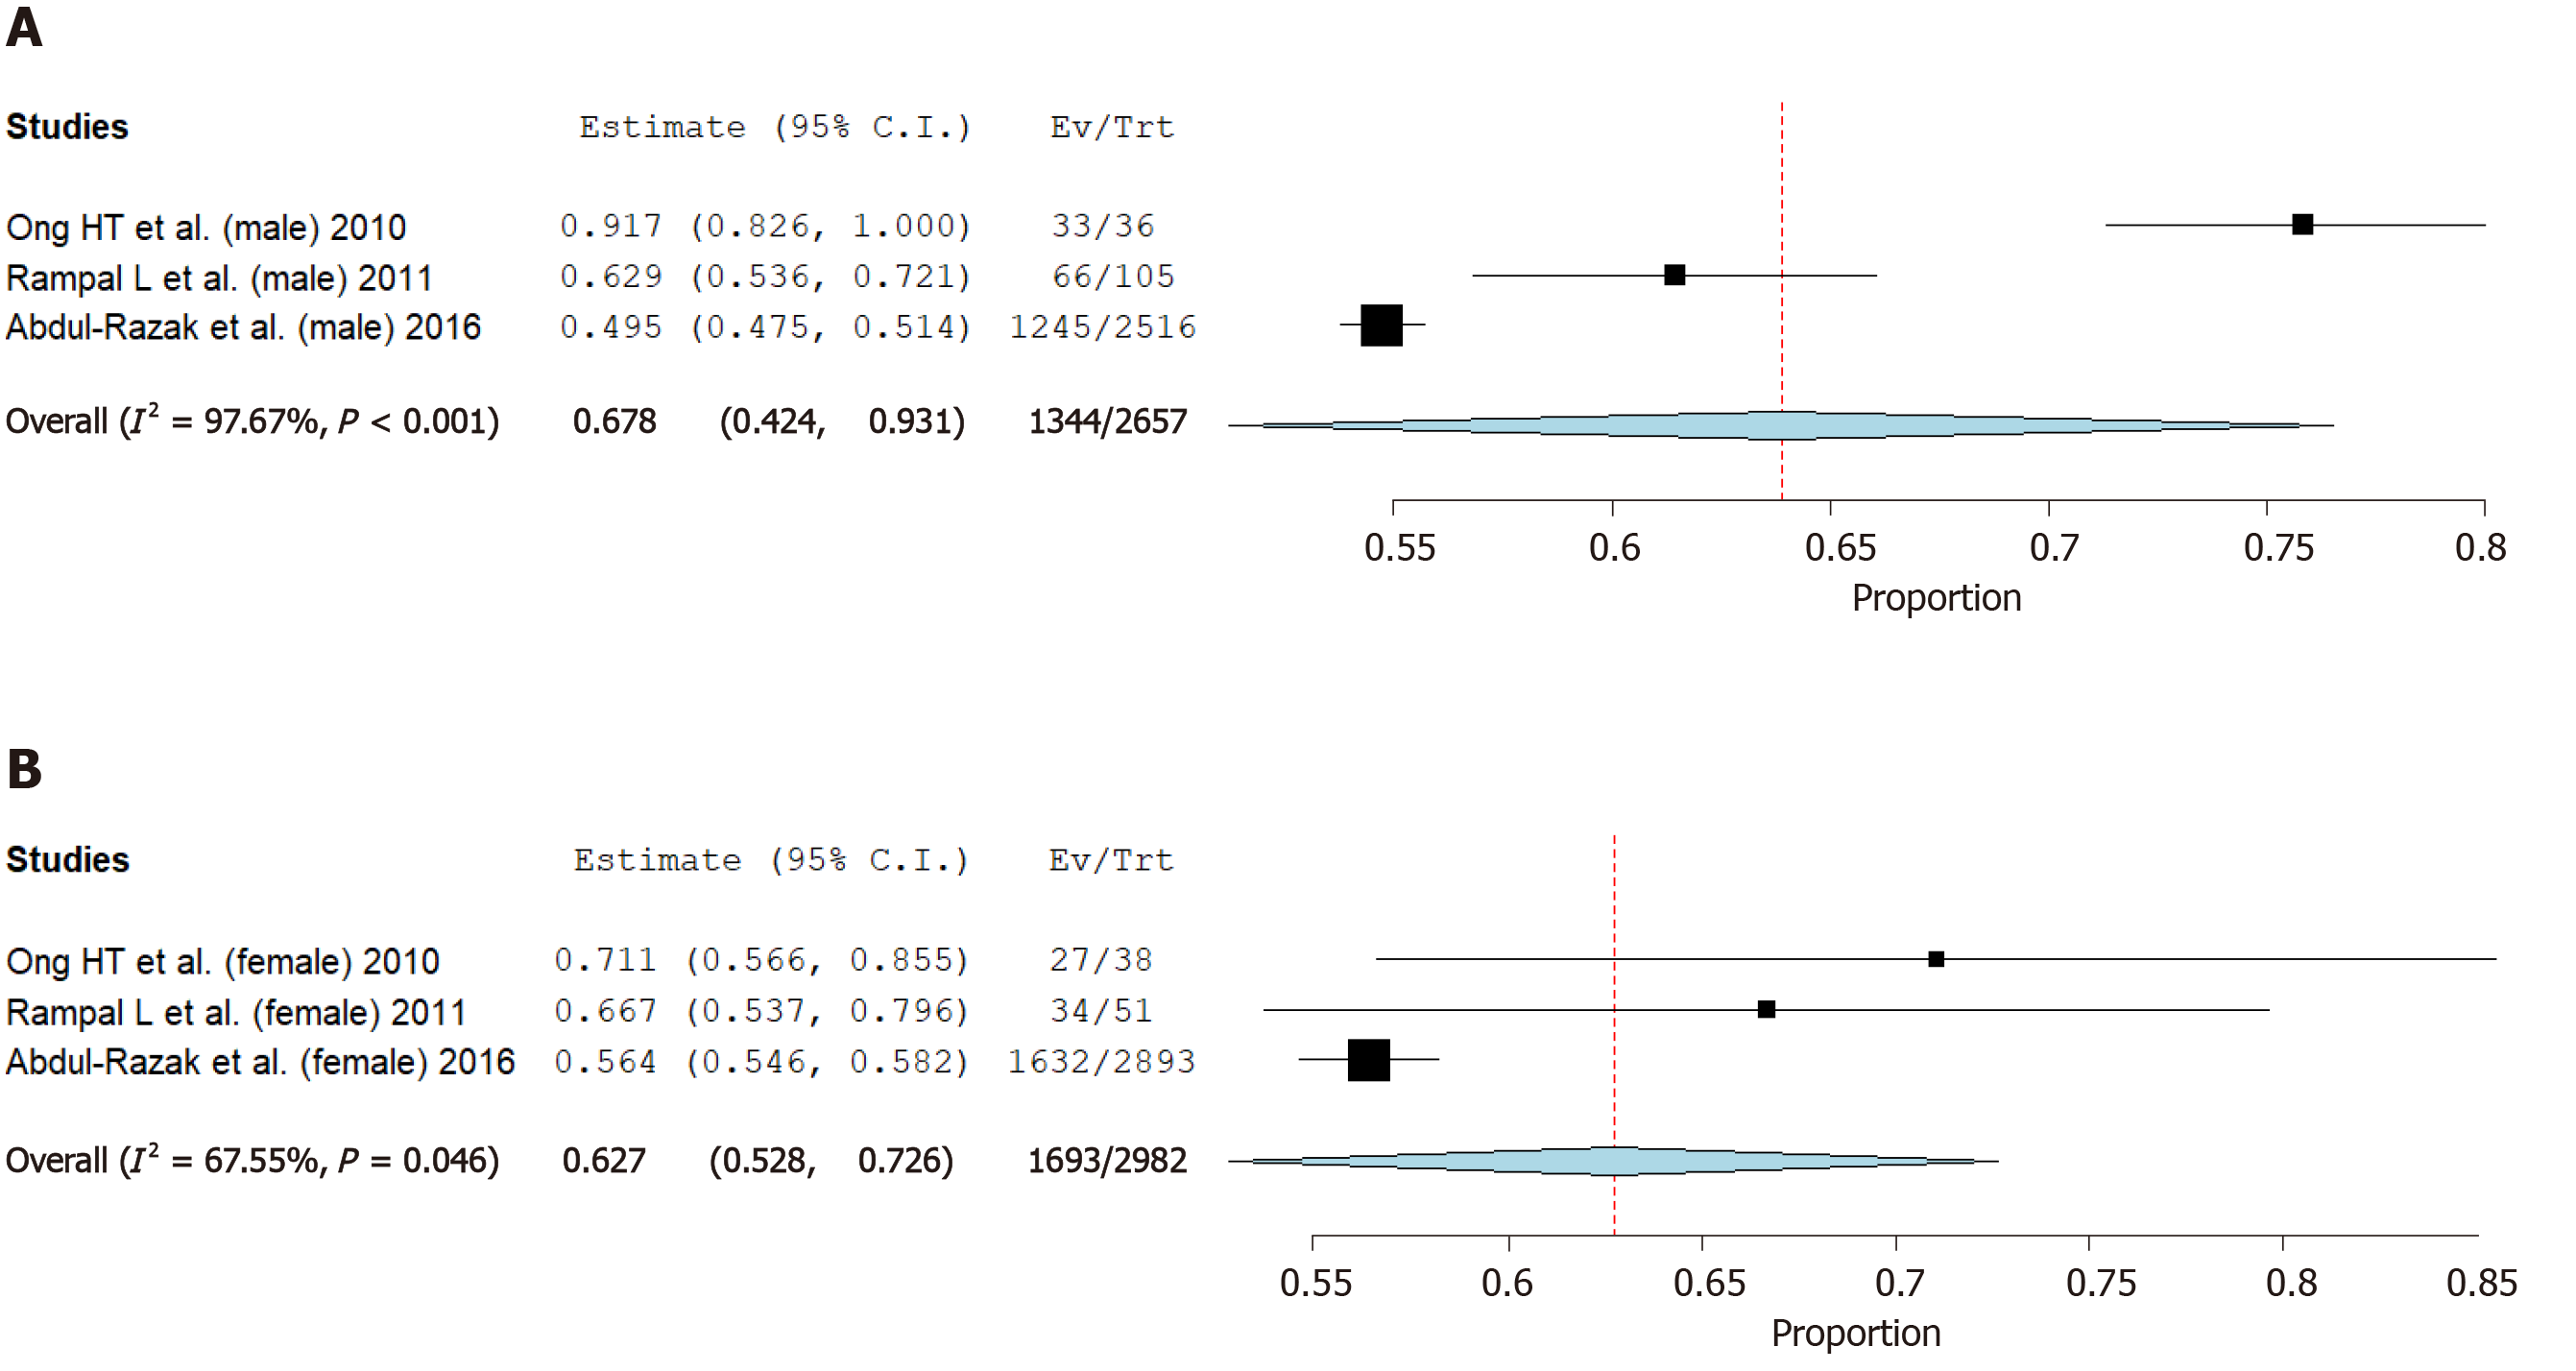
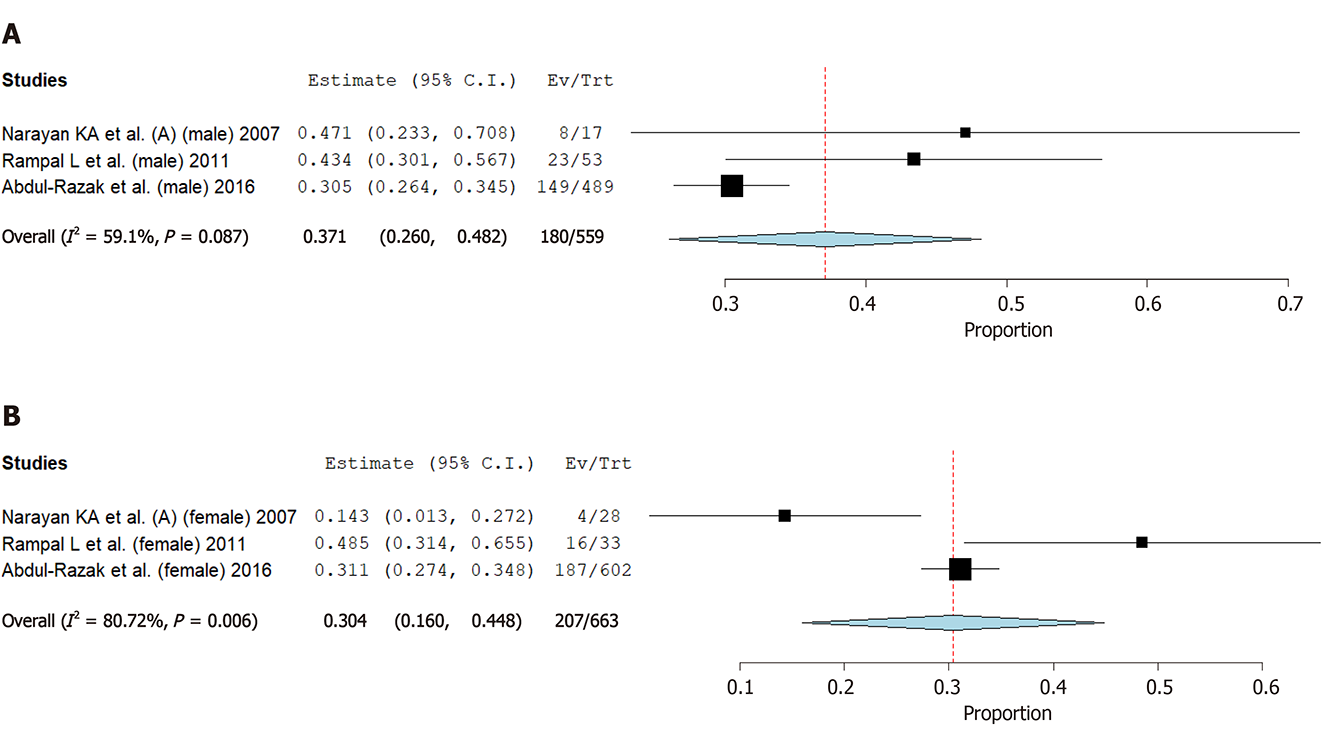
Figure 5 Pooled prevalence of hypertension in male and female adults.
A: In male adults; B: In female adults.
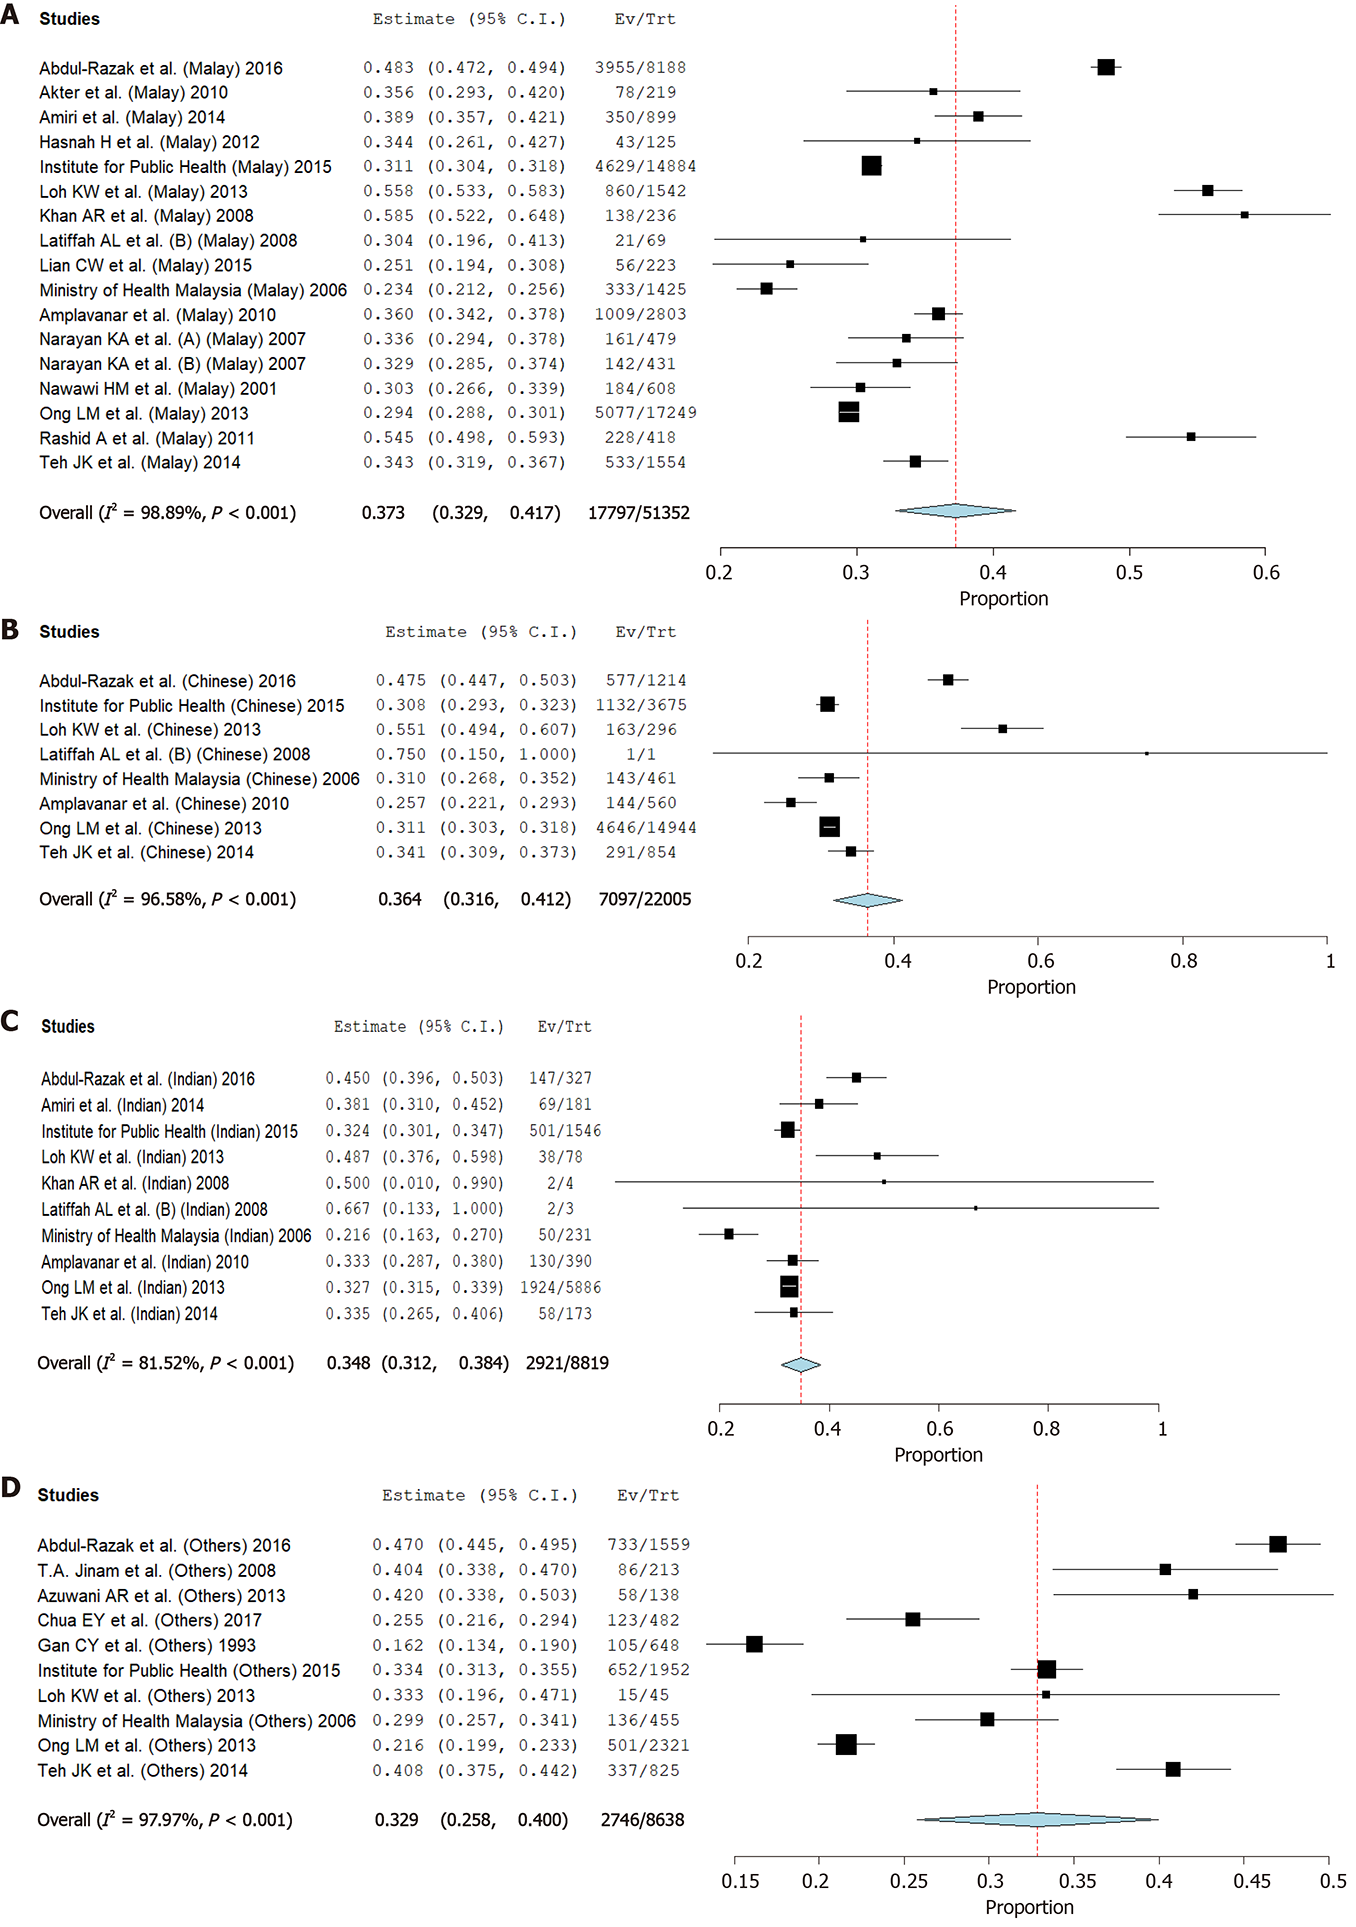
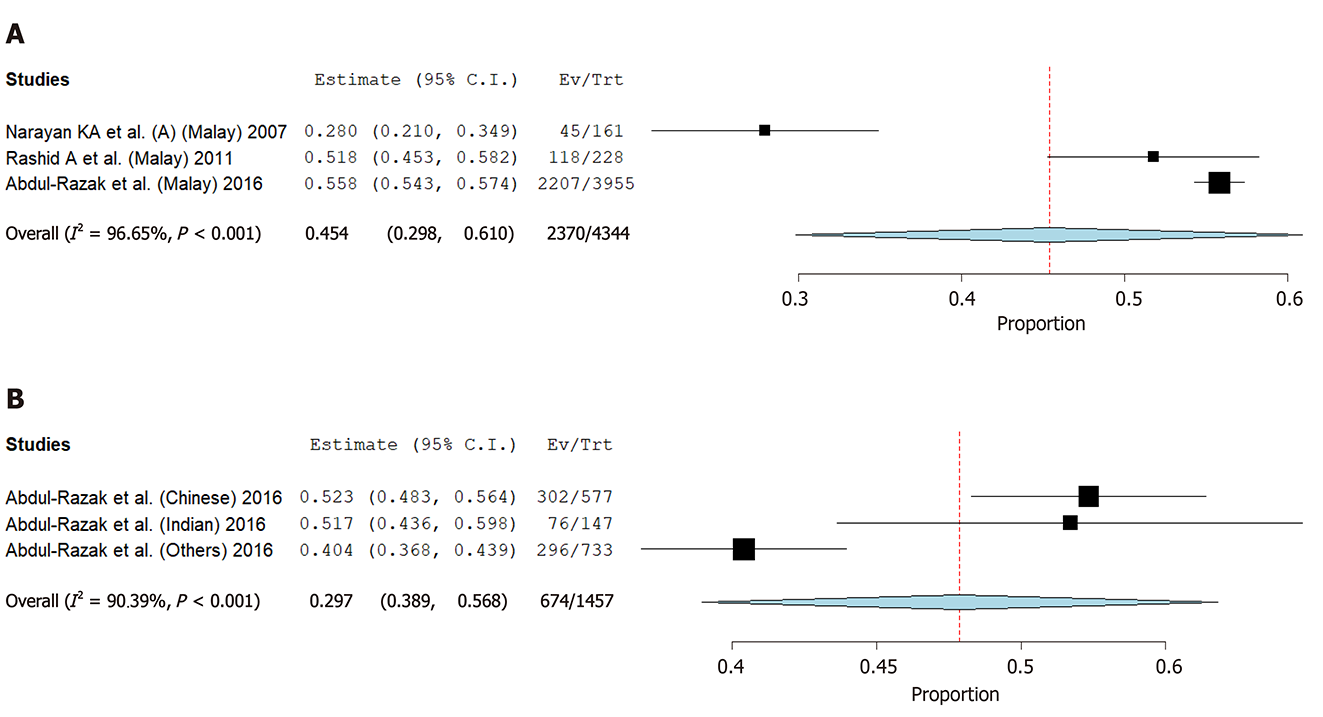
Figure 6 Pooled prevalence of hypertension in Malay, Chinese, Indian and other ethnicity.
A: In Malay; B: In Chinese; C: In Indian; D: In other ethnicity.
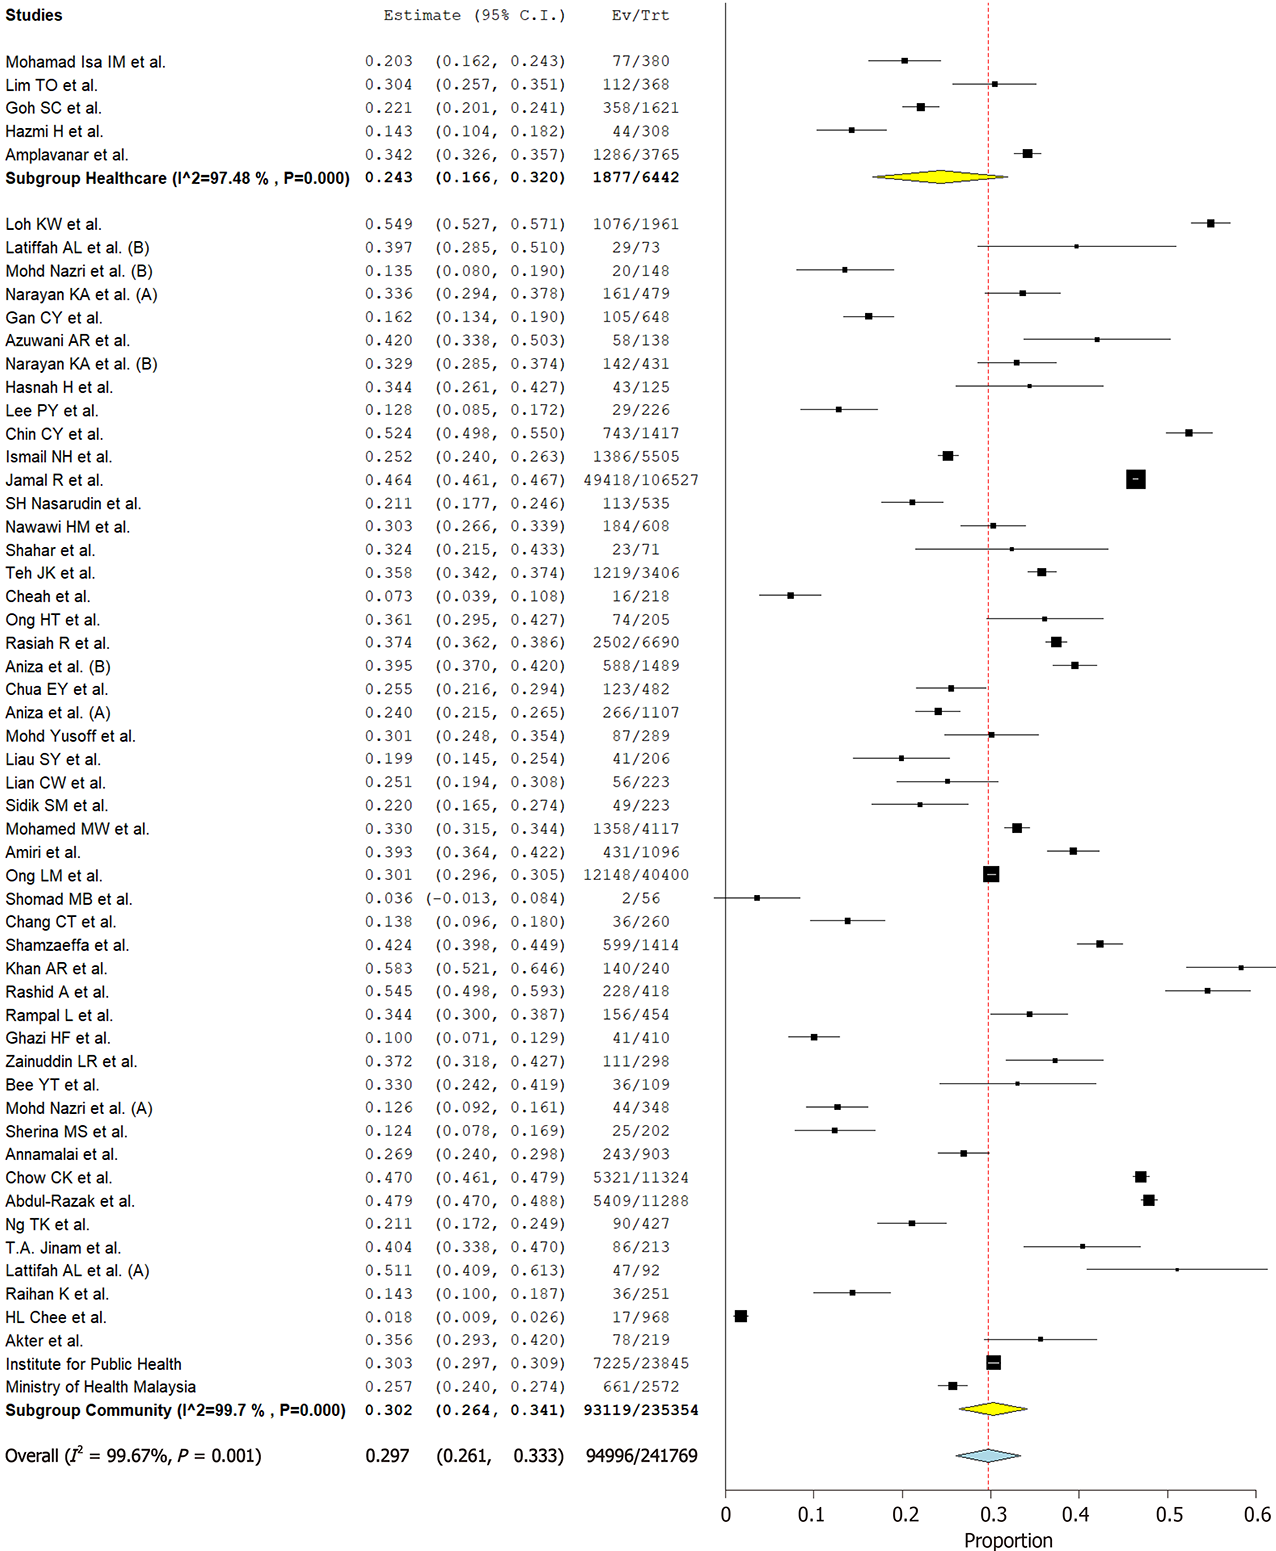
Figure 7 Prevalence of hypertension subanalysis by study setting.
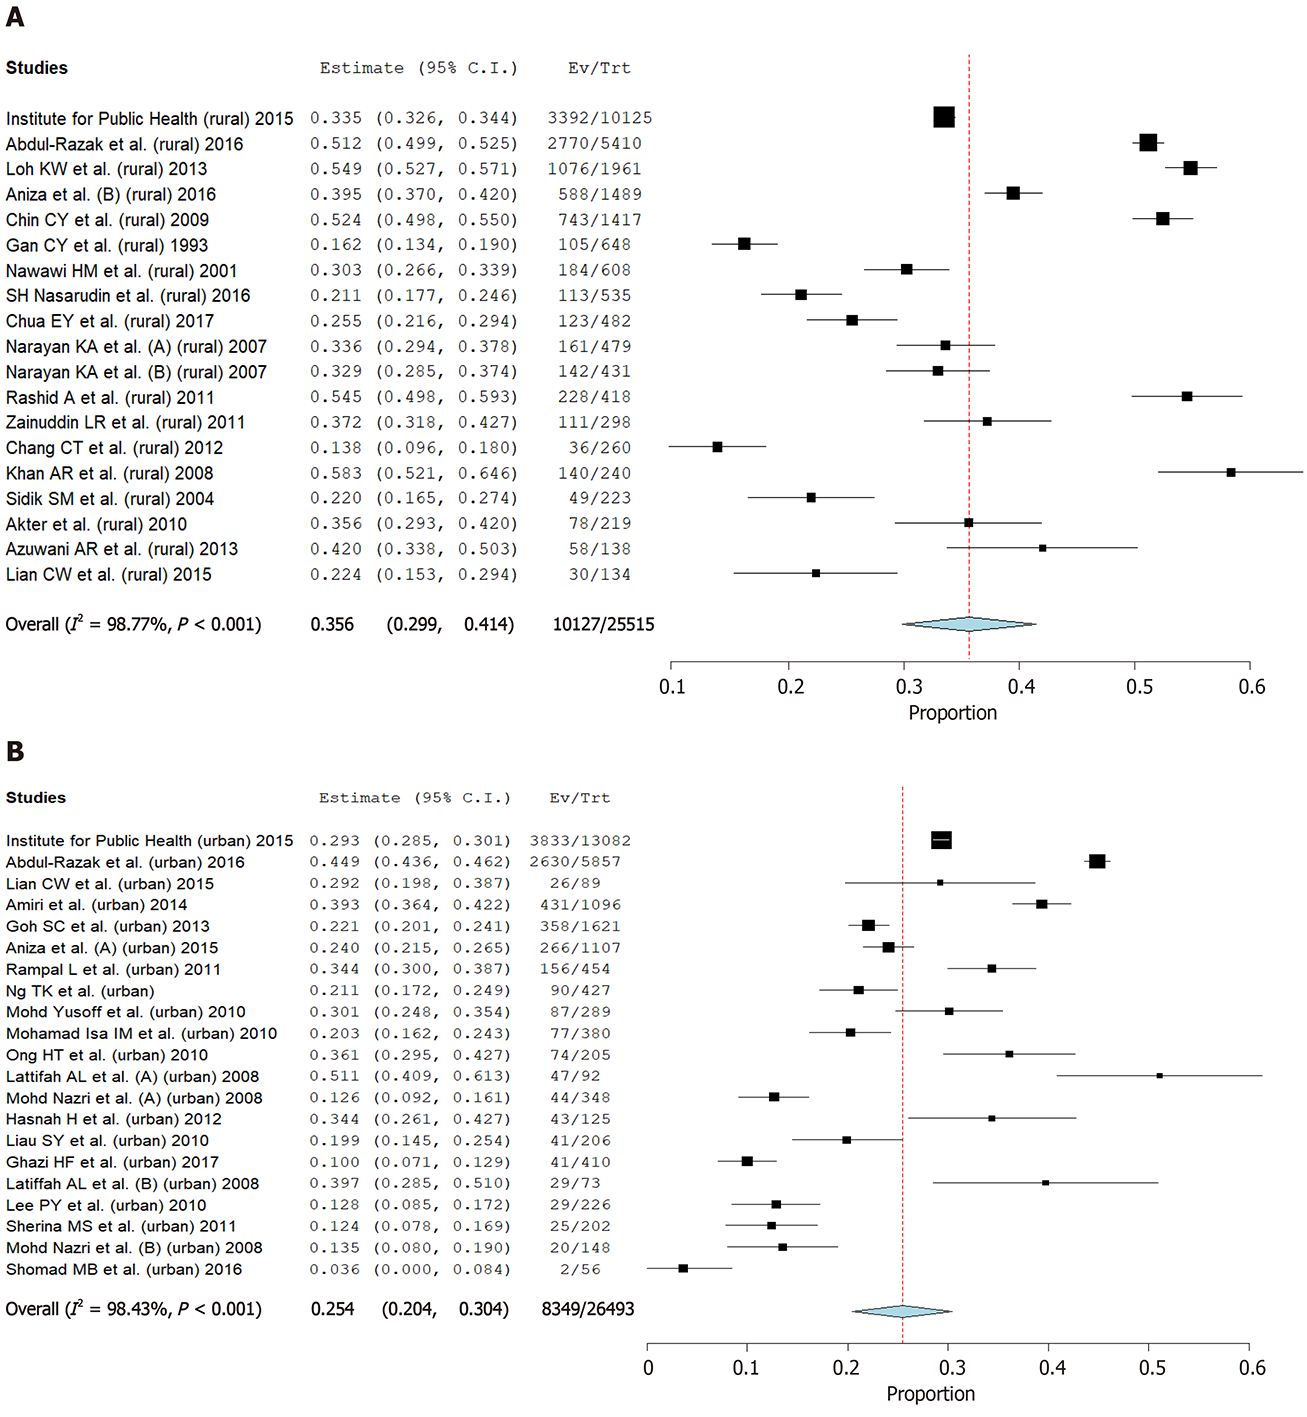
Figure 8 Pooled prevalence of hypertension in rural and urban area.
A: In rural areas; B: In urban areas.
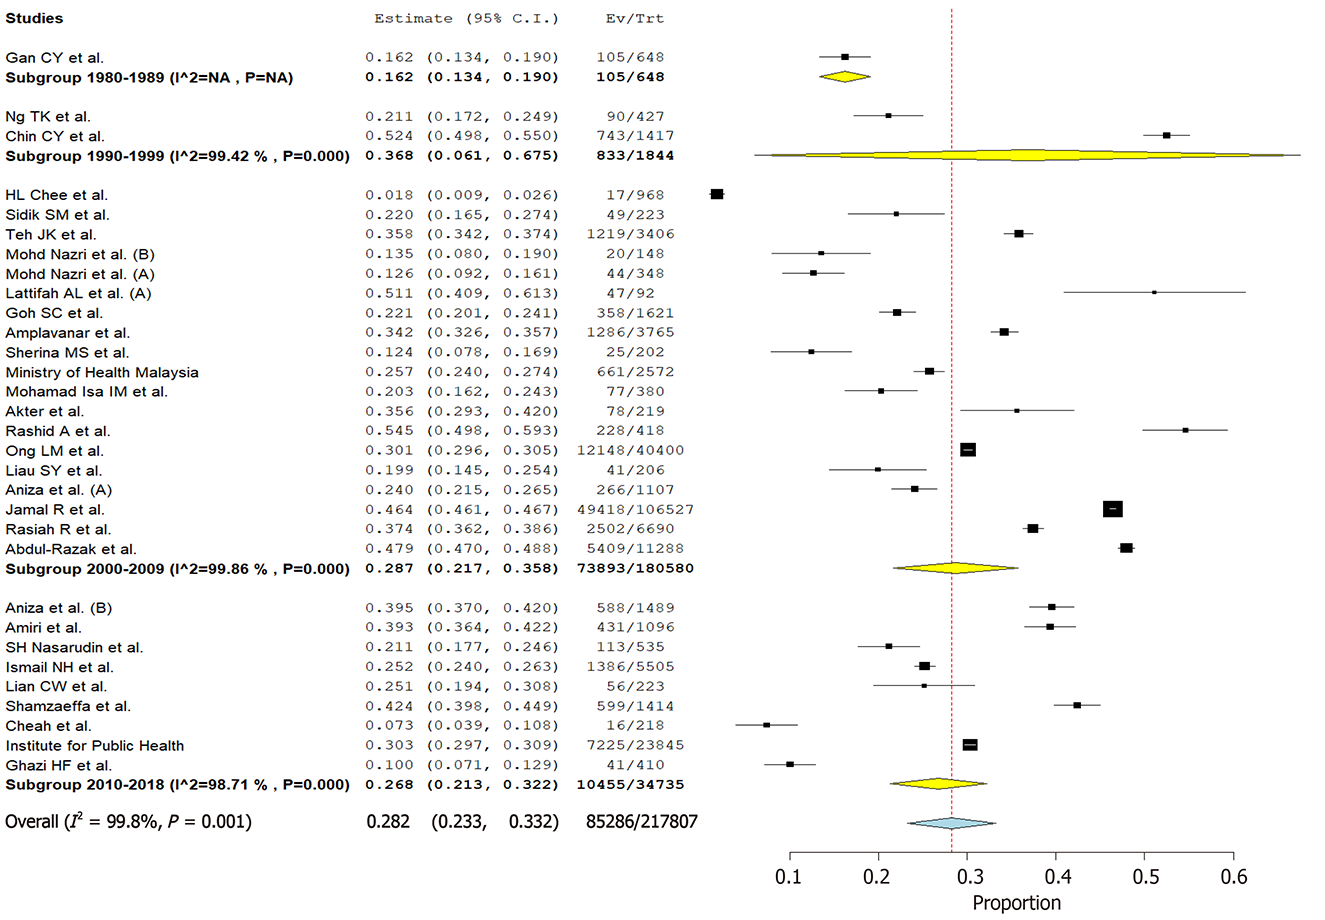
Figure 9 Overall pooled prevalence of hypertension subgroup by study decade.
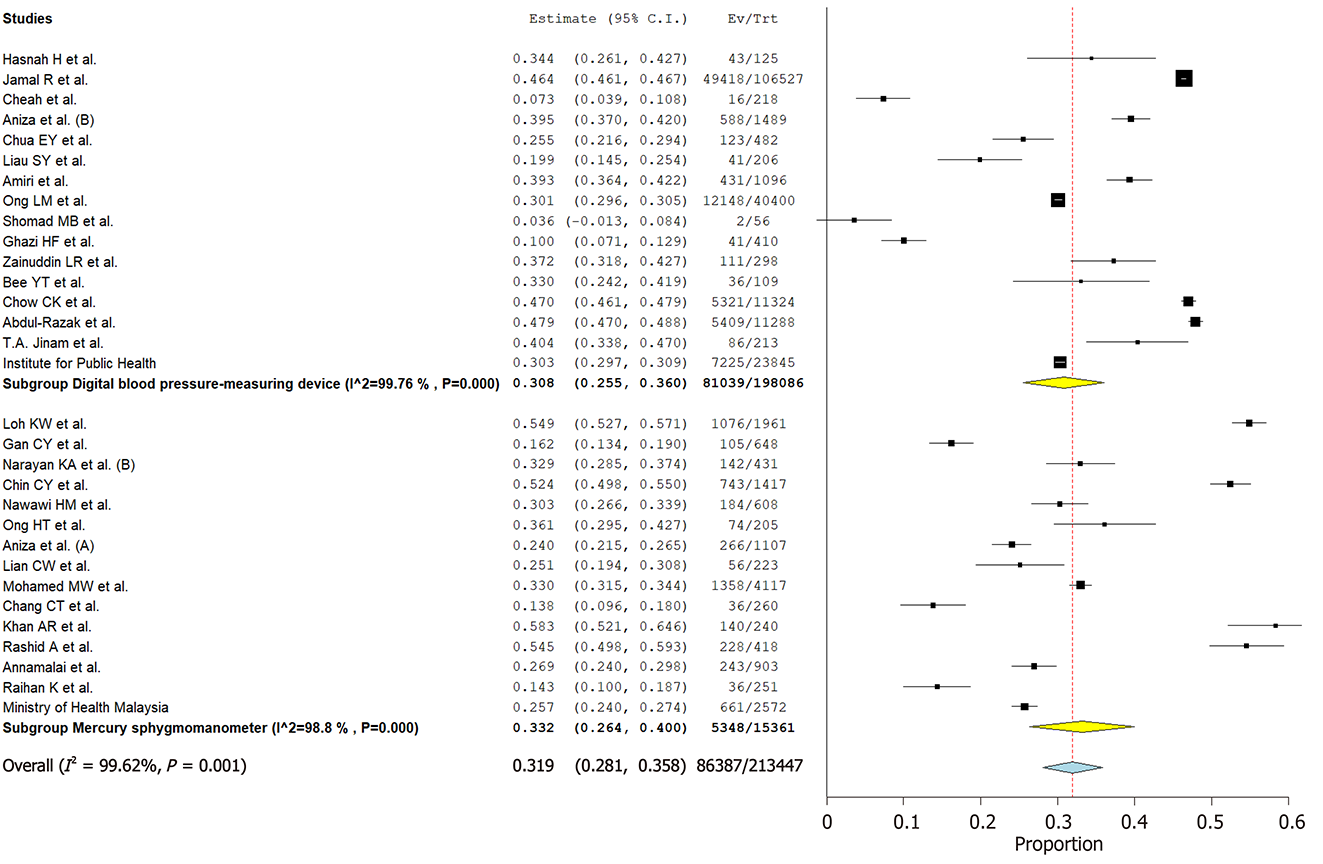
Figure 10 Pooled prevalence of hypertension subanalysis by measurement tools.
Figure 11 Pooled prevalence of awareness in hypertension.
Figure 12 Pooled prevalence of awareness in hypertension in male and female.
A: In male; B: In female.
Figure 13 Pooled prevalence of awareness in hypertension in Malay and non-Malay.
A: In Malay; B: In non-Malay.
Figure 14 Pooled prevalence of awareness in hypertension in rural areas.
Figure 15 Pooled prevalence of control in hypertension.
Figure 16 Pooled prevalence of control in hypertension in male and female.
A: In male; B: In female.
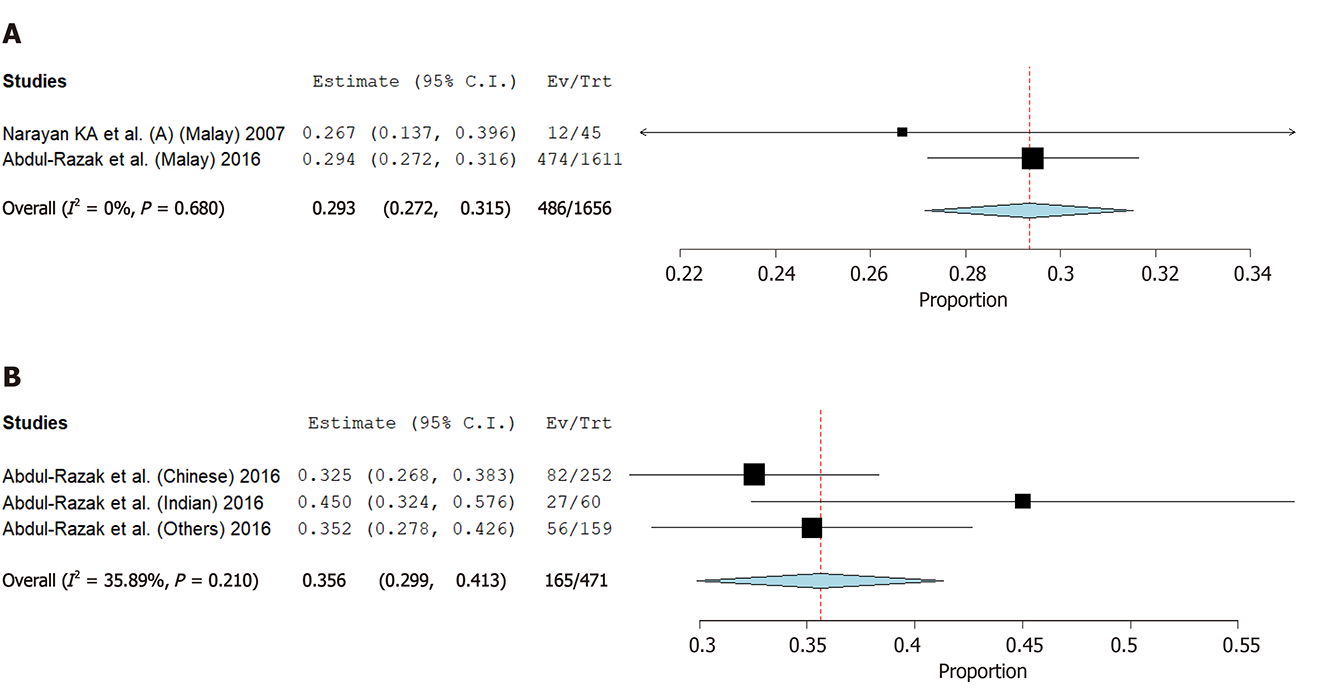
Figure 17 Pooled prevalence of control in hypertension in Malay and non-Malay.
A: In Malay; B: In non-Malay.
Figure 18 Pooled prevalence of control in hypertension in rural areas.
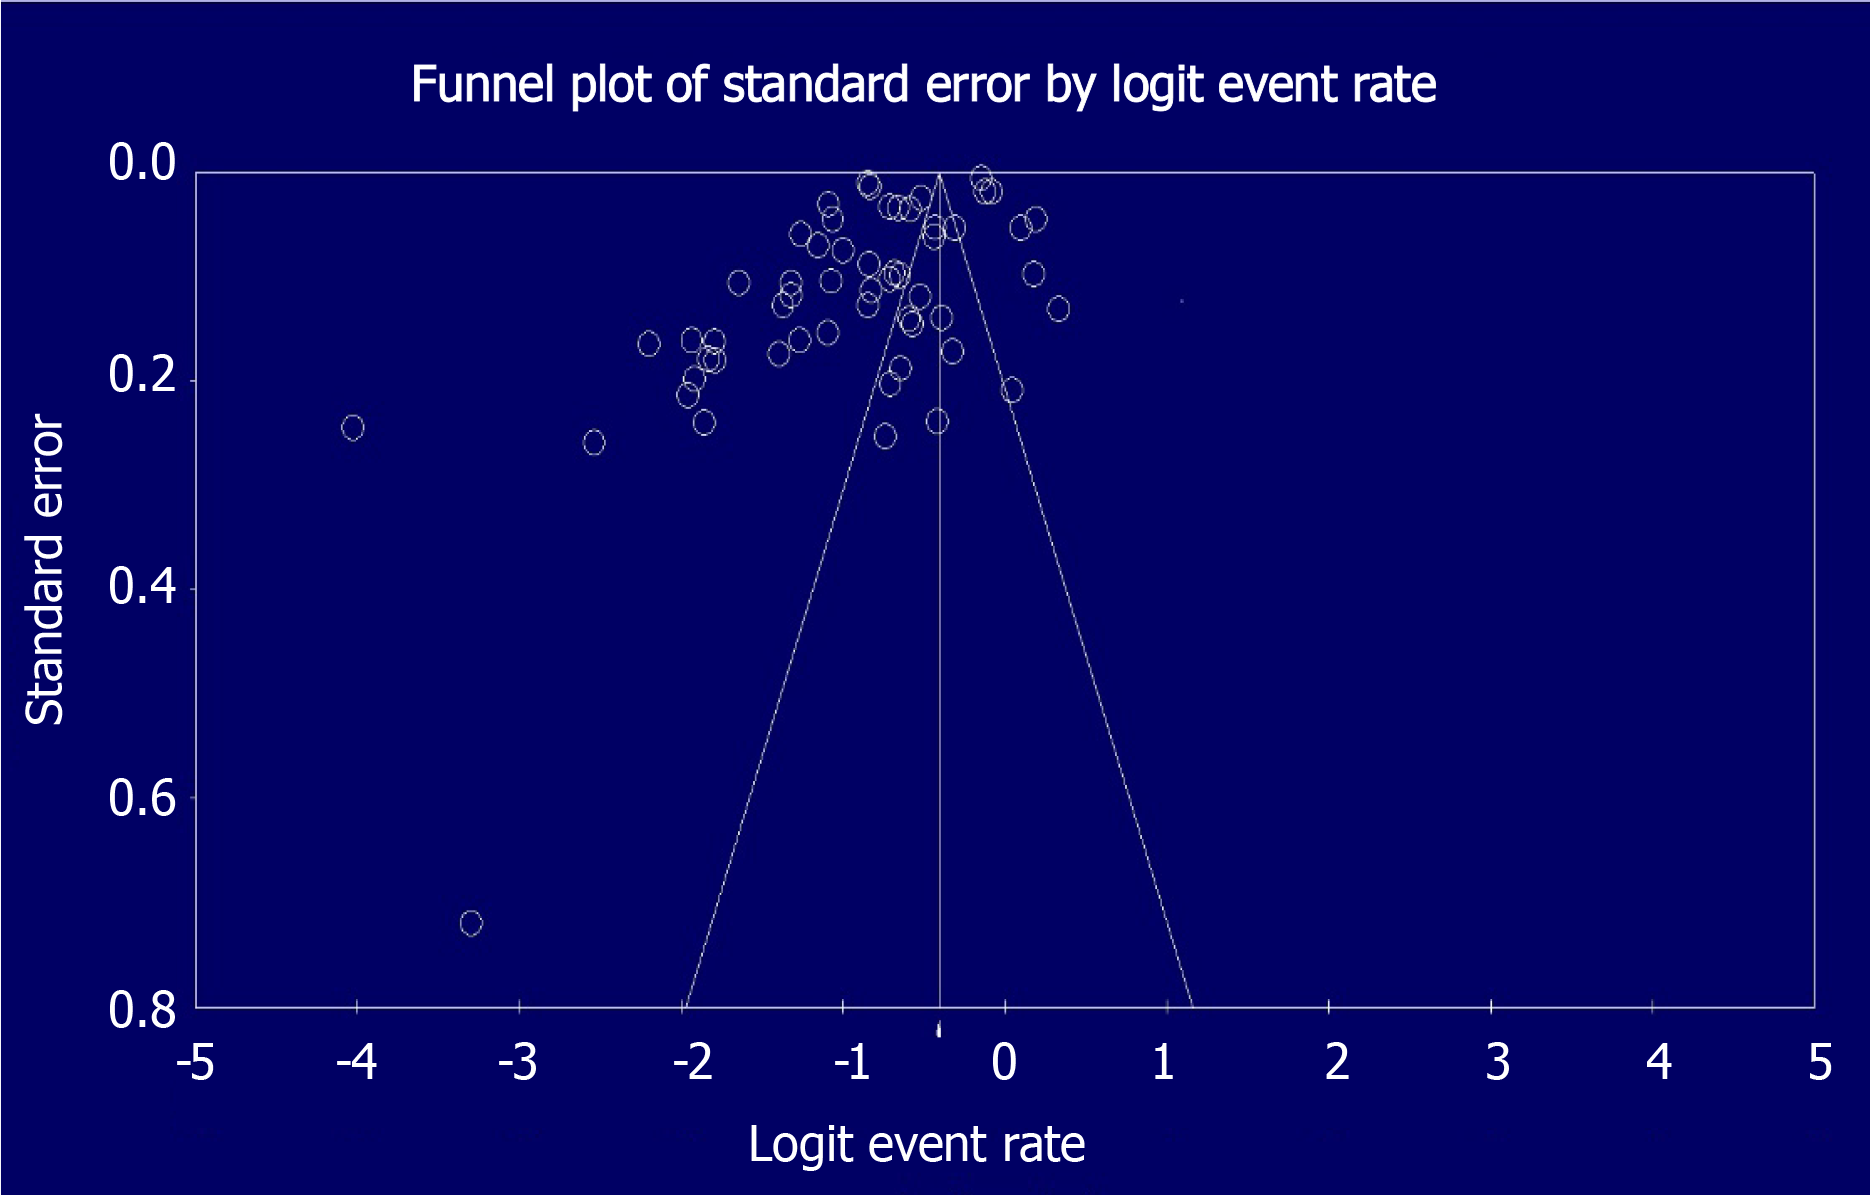
Figure 19 Publication bias assessed using funnel plot.
- Citation: Soo MJ, Chow ZY, Ching SM, Tan CH, Lee KW, Devaraj NK, Salim HS, Ramachandran V, Lim PY, Sivaratnam D, Hoo FK, Cheong AT, Chia YC. Prevalence, awareness and control of hypertension in Malaysia from 1980-2018: A systematic review and meta-analysis. World J Meta-Anal 2020; 8(4): 320-344
- URL: https://www.wjgnet.com/2308-3840/full/v8/i4/320.htm
- DOI: https://dx.doi.org/10.13105/wjma.v8.i4.320


