Copyright
©The Author(s) 2020.
World J Meta-Anal. Feb 28, 2020; 8(1): 15-26
Published online Feb 28, 2020. doi: 10.13105/wjma.v8.i1.15
Published online Feb 28, 2020. doi: 10.13105/wjma.v8.i1.15
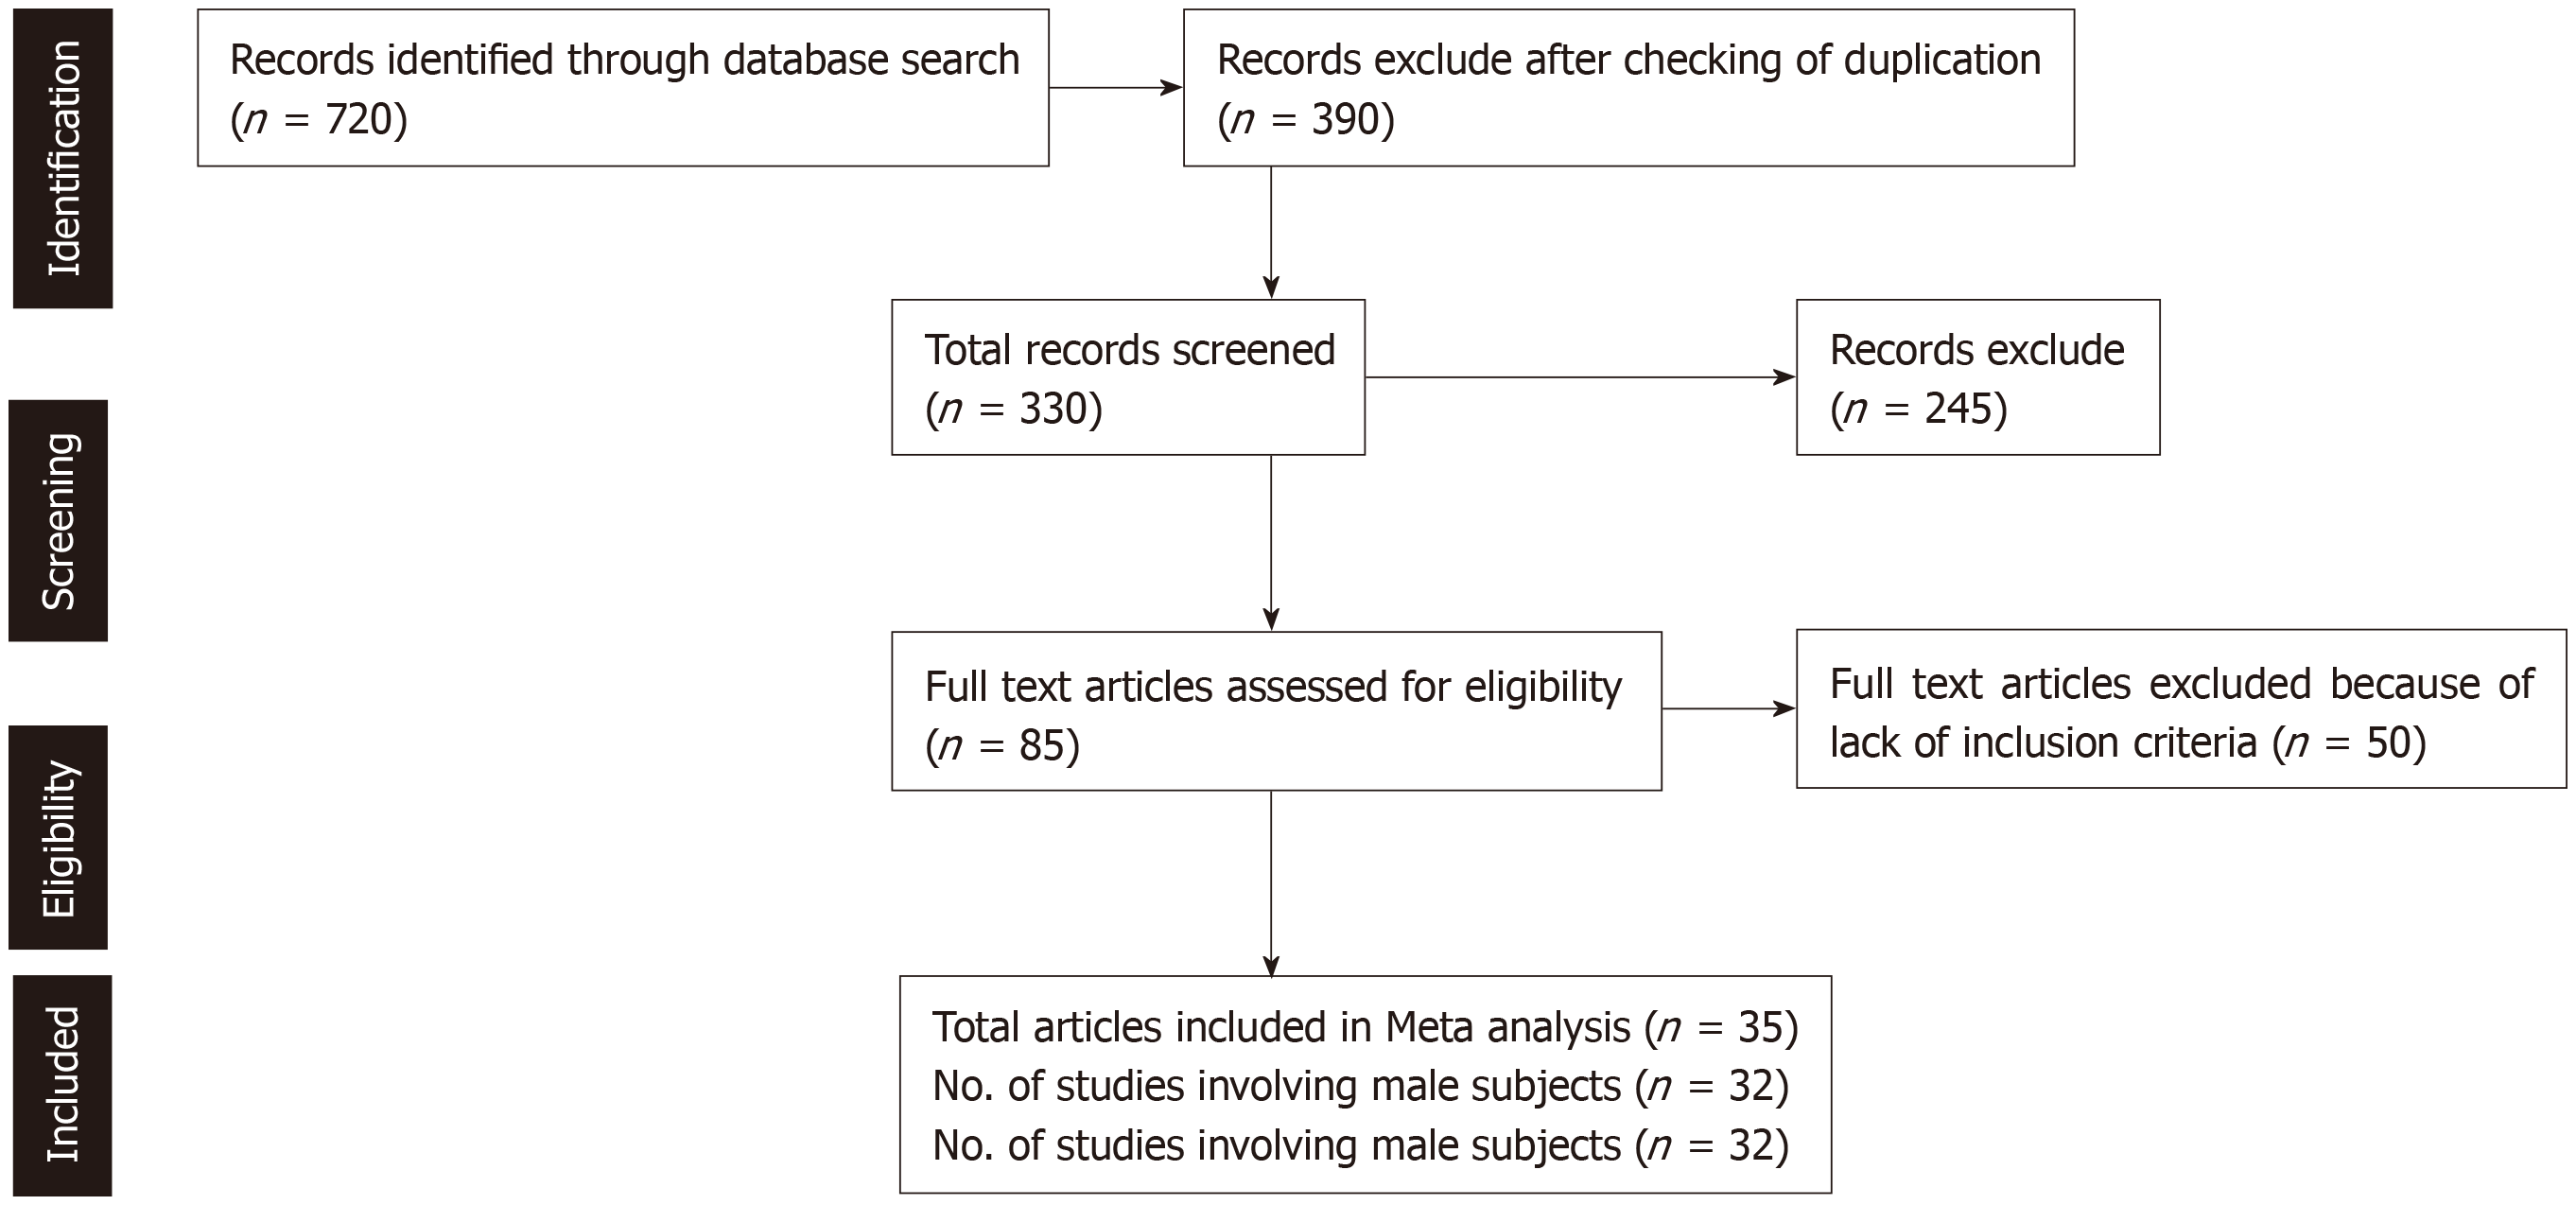
Figure 1 Flowchart showing the selection process of relevant studies.
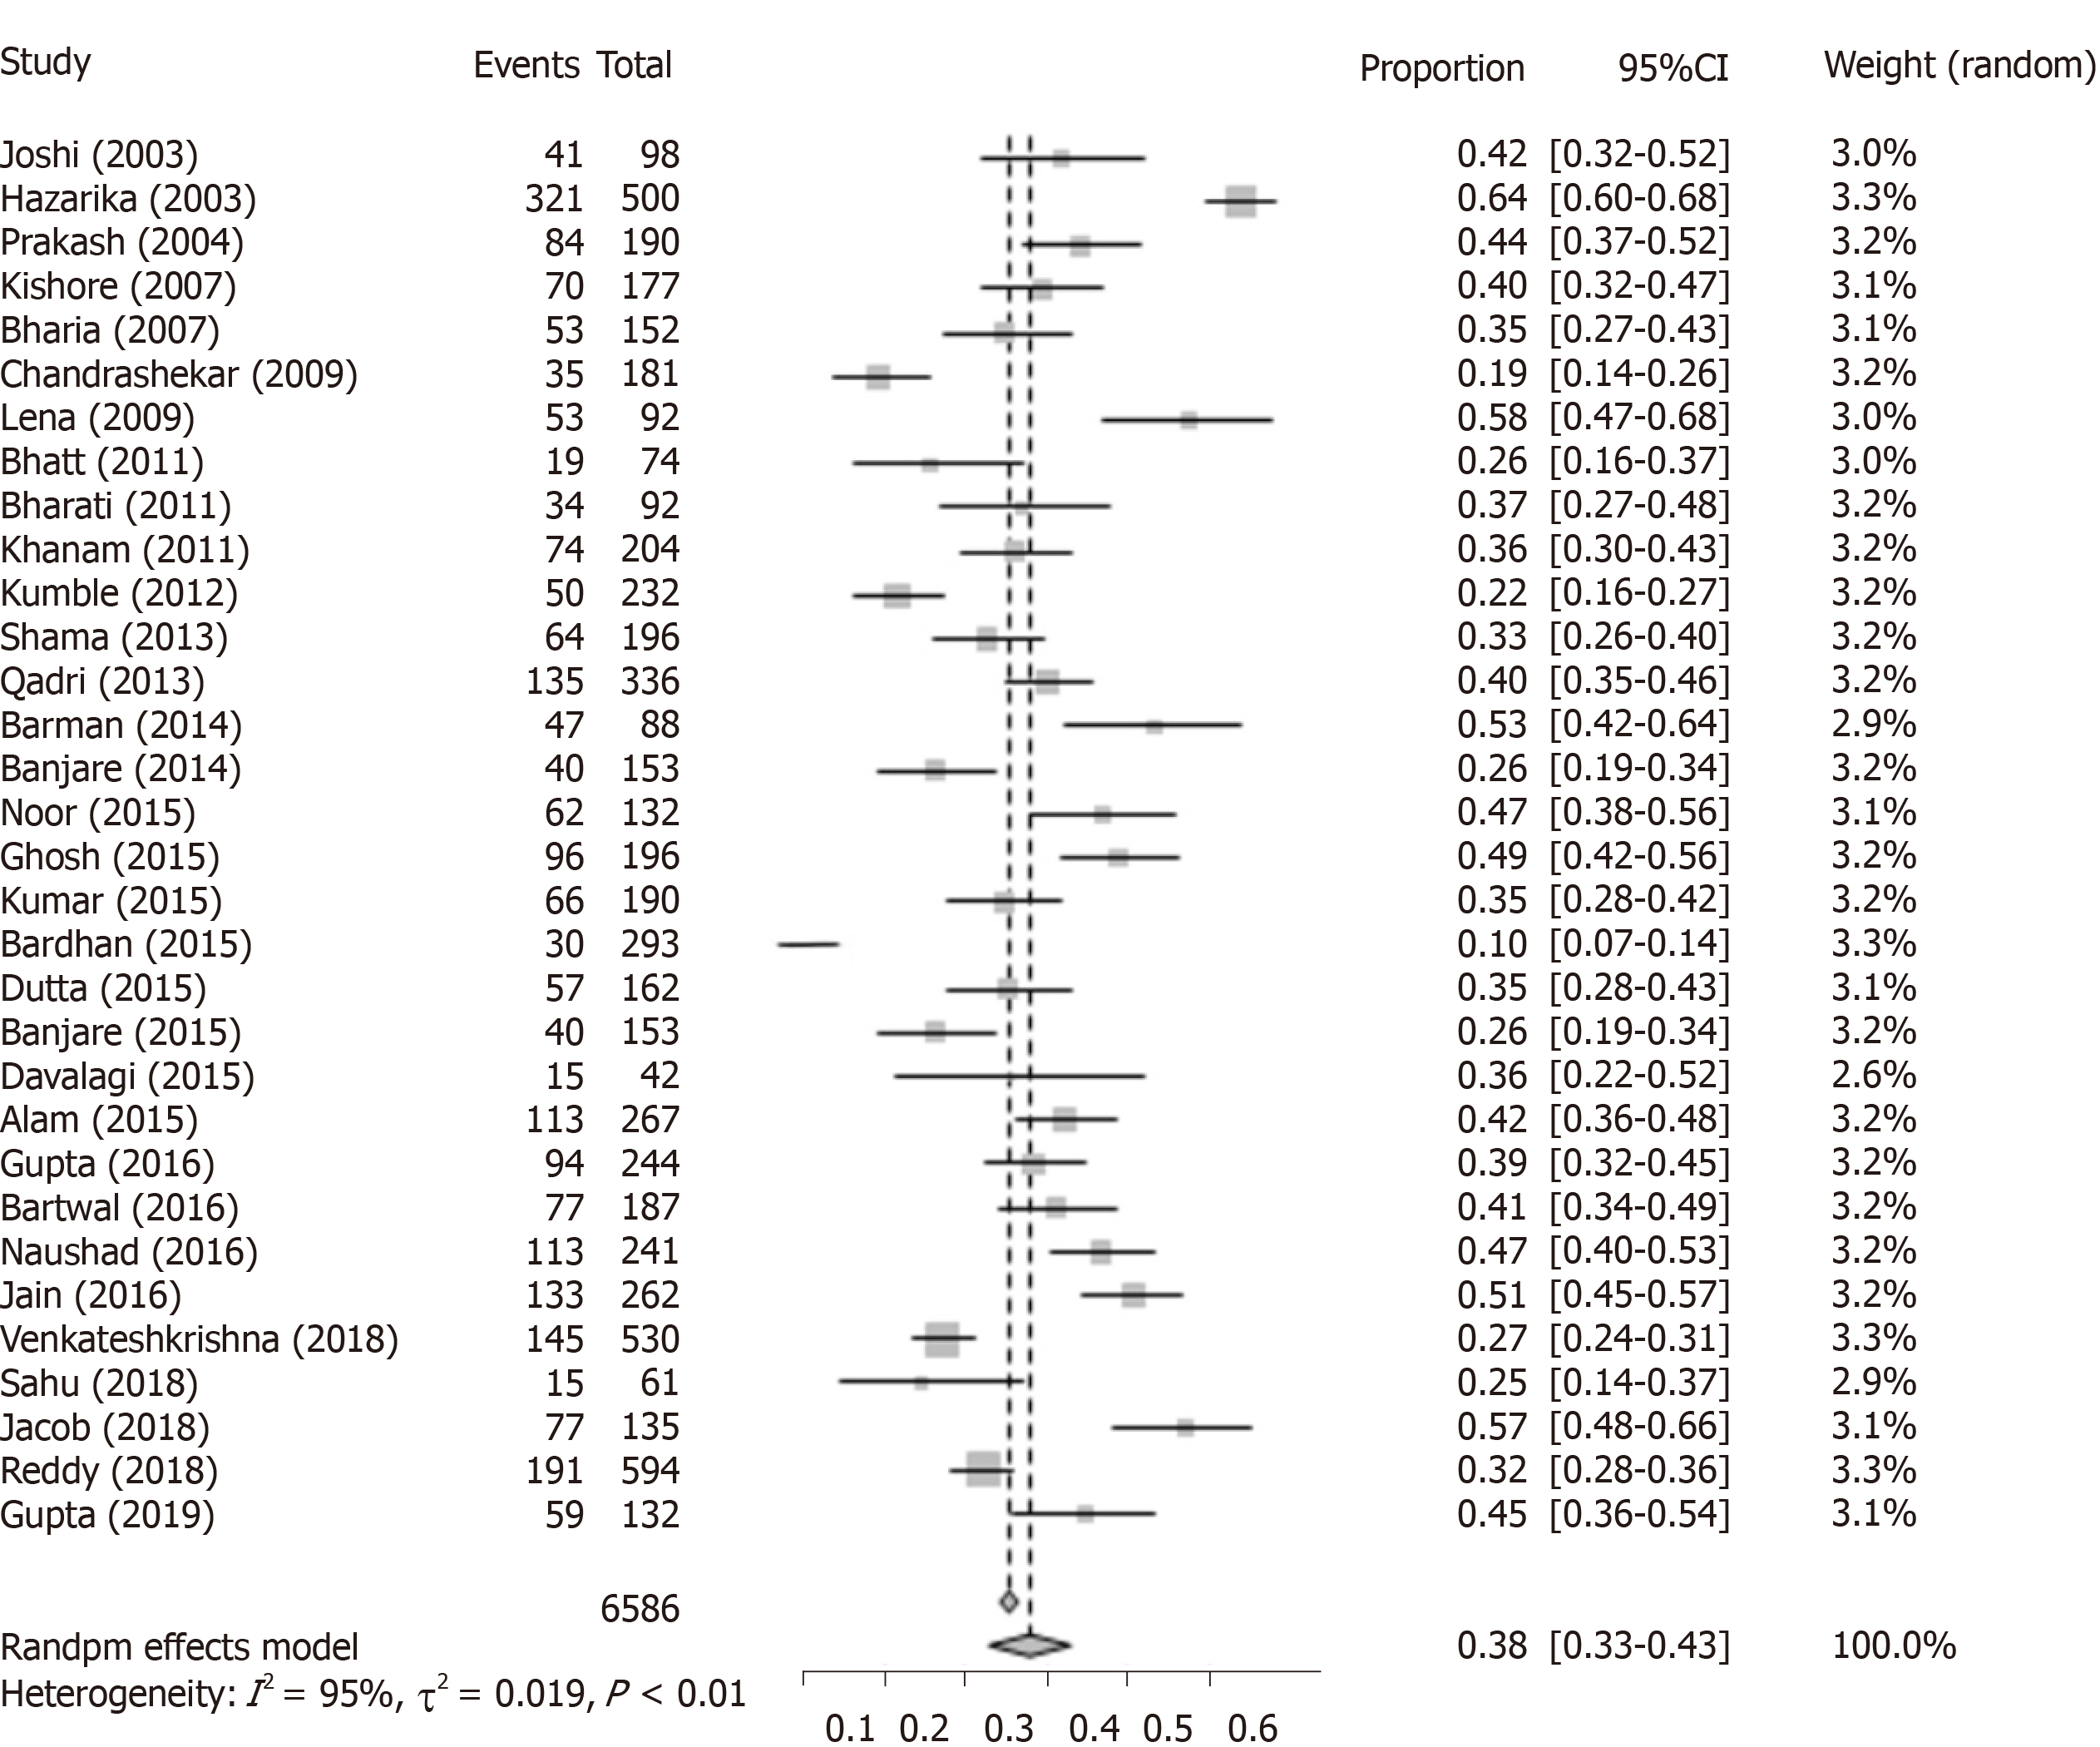
Figure 2 Forest plot of the meta-analysis of cardiovascular disease prevalence in the male Indian geriatric population.
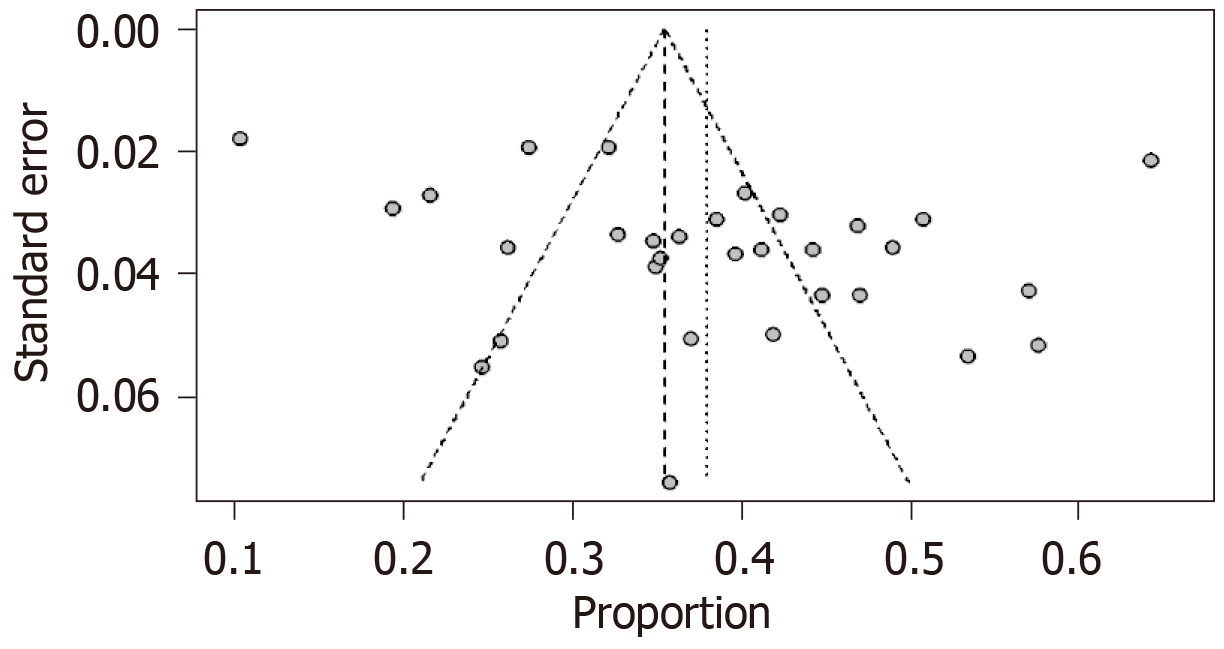
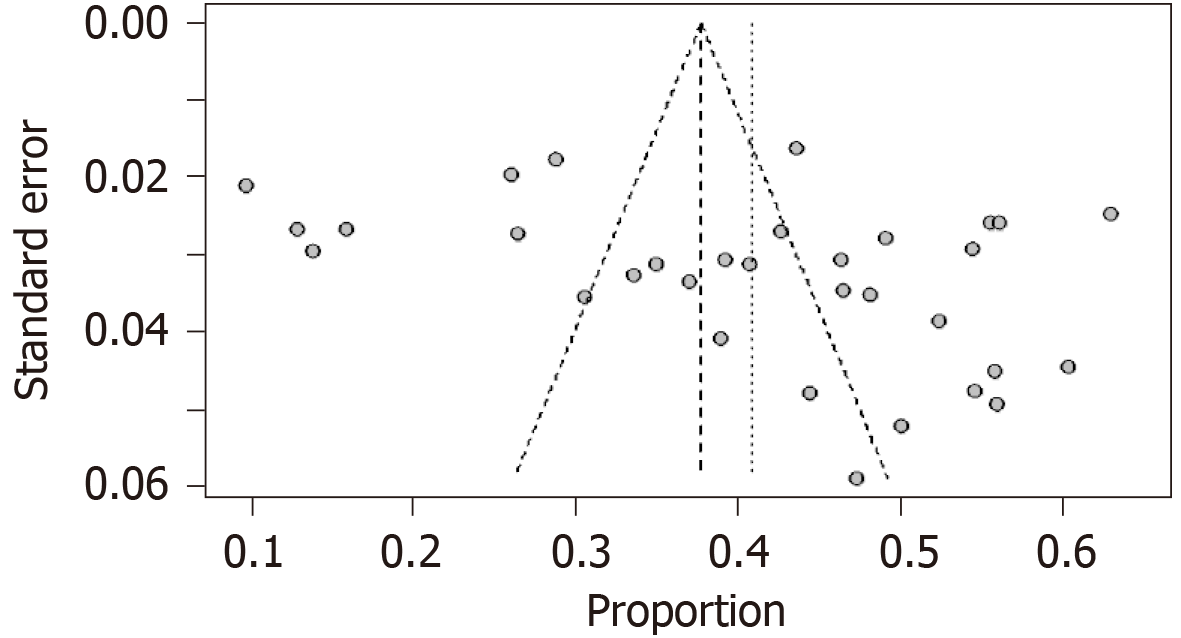
Figure 3 Funnel plot showing publication bias in the meta-analysis of the prevalence of cardiovascular diseases in the male Indian geriatric population.
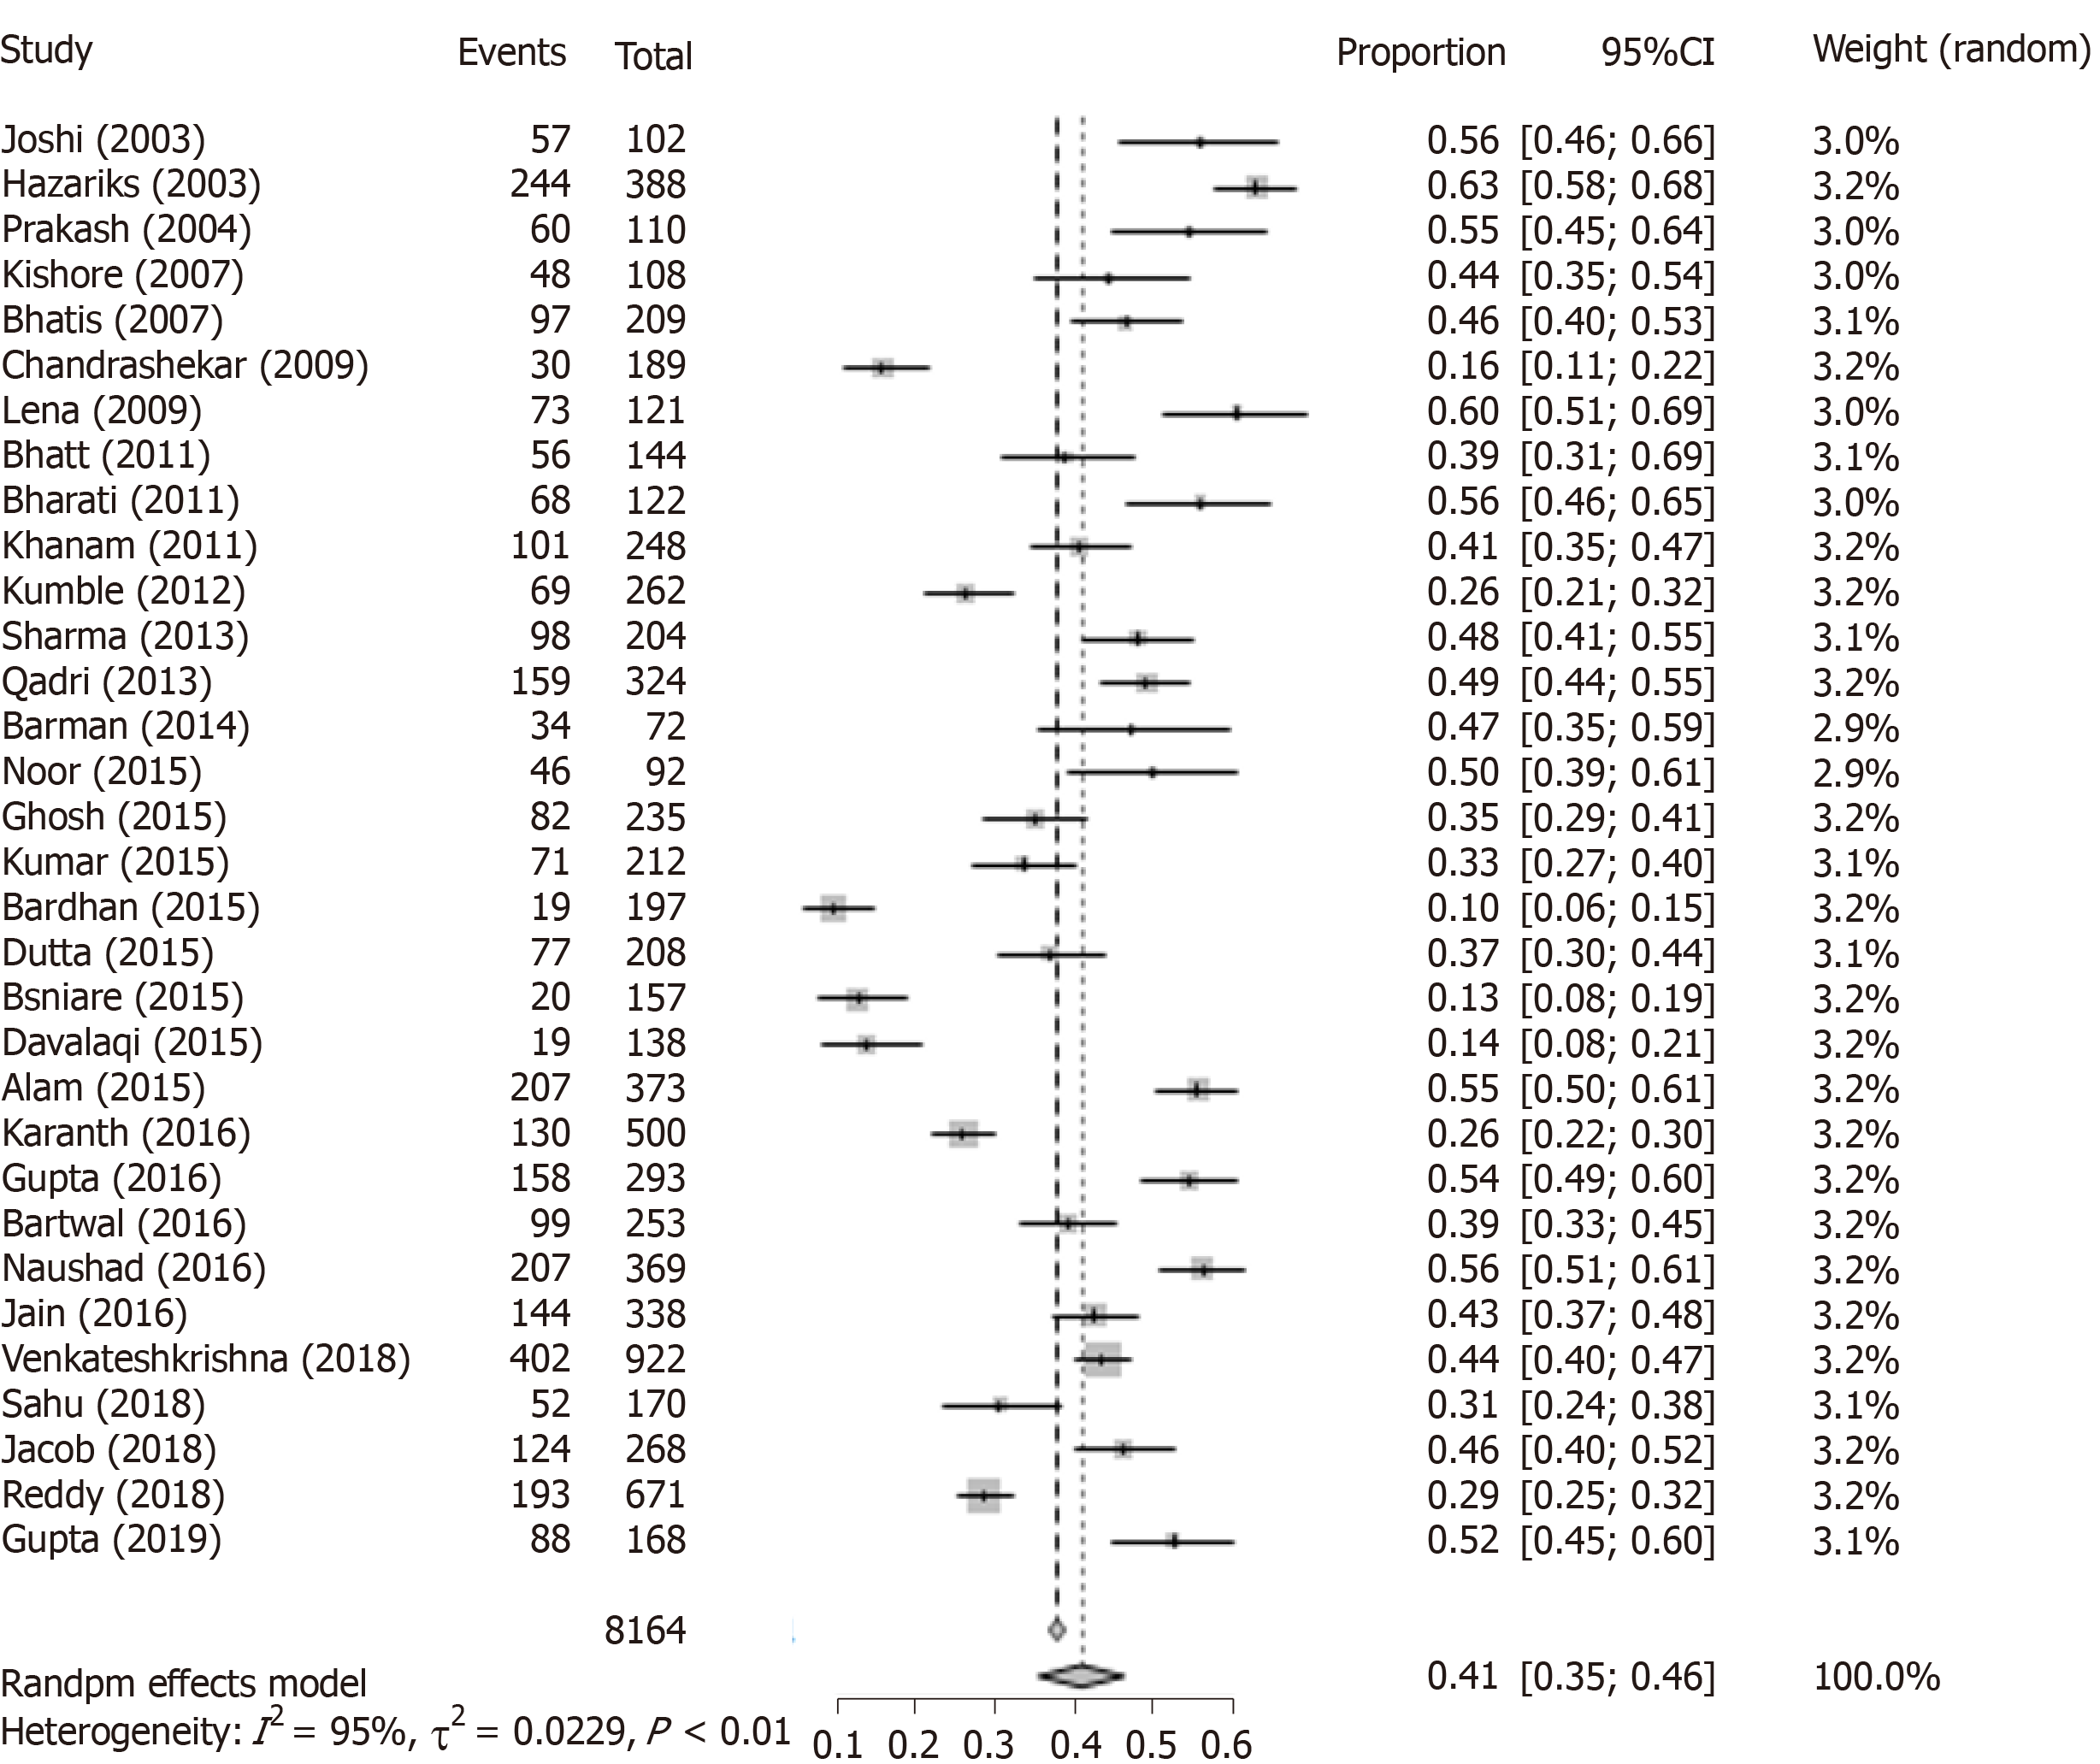
Figure 4 Forest plot of the meta-analysis of cardiovascular disease prevalence in the female Indian geriatric population.
Figure 5 Funnel plot showing publication bias in the meta-analysis of prevalence of cardiovascular diseases in the female Indian geriatric population.
- Citation: Nanda H, Shivgotra VK. Gender prevalence of cardiovascular diseases in the geriatric population of India: A meta-analysis using R. World J Meta-Anal 2020; 8(1): 15-26
- URL: https://www.wjgnet.com/2308-3840/full/v8/i1/15.htm
- DOI: https://dx.doi.org/10.13105/wjma.v8.i1.15


