©The Author(s) 2019.
World J Meta-Anal. Jan 10, 2019; 7(1): 1-30
Published online Jan 10, 2019. doi: 10.13105/wjma.v7.i1.1
Published online Jan 10, 2019. doi: 10.13105/wjma.v7.i1.1
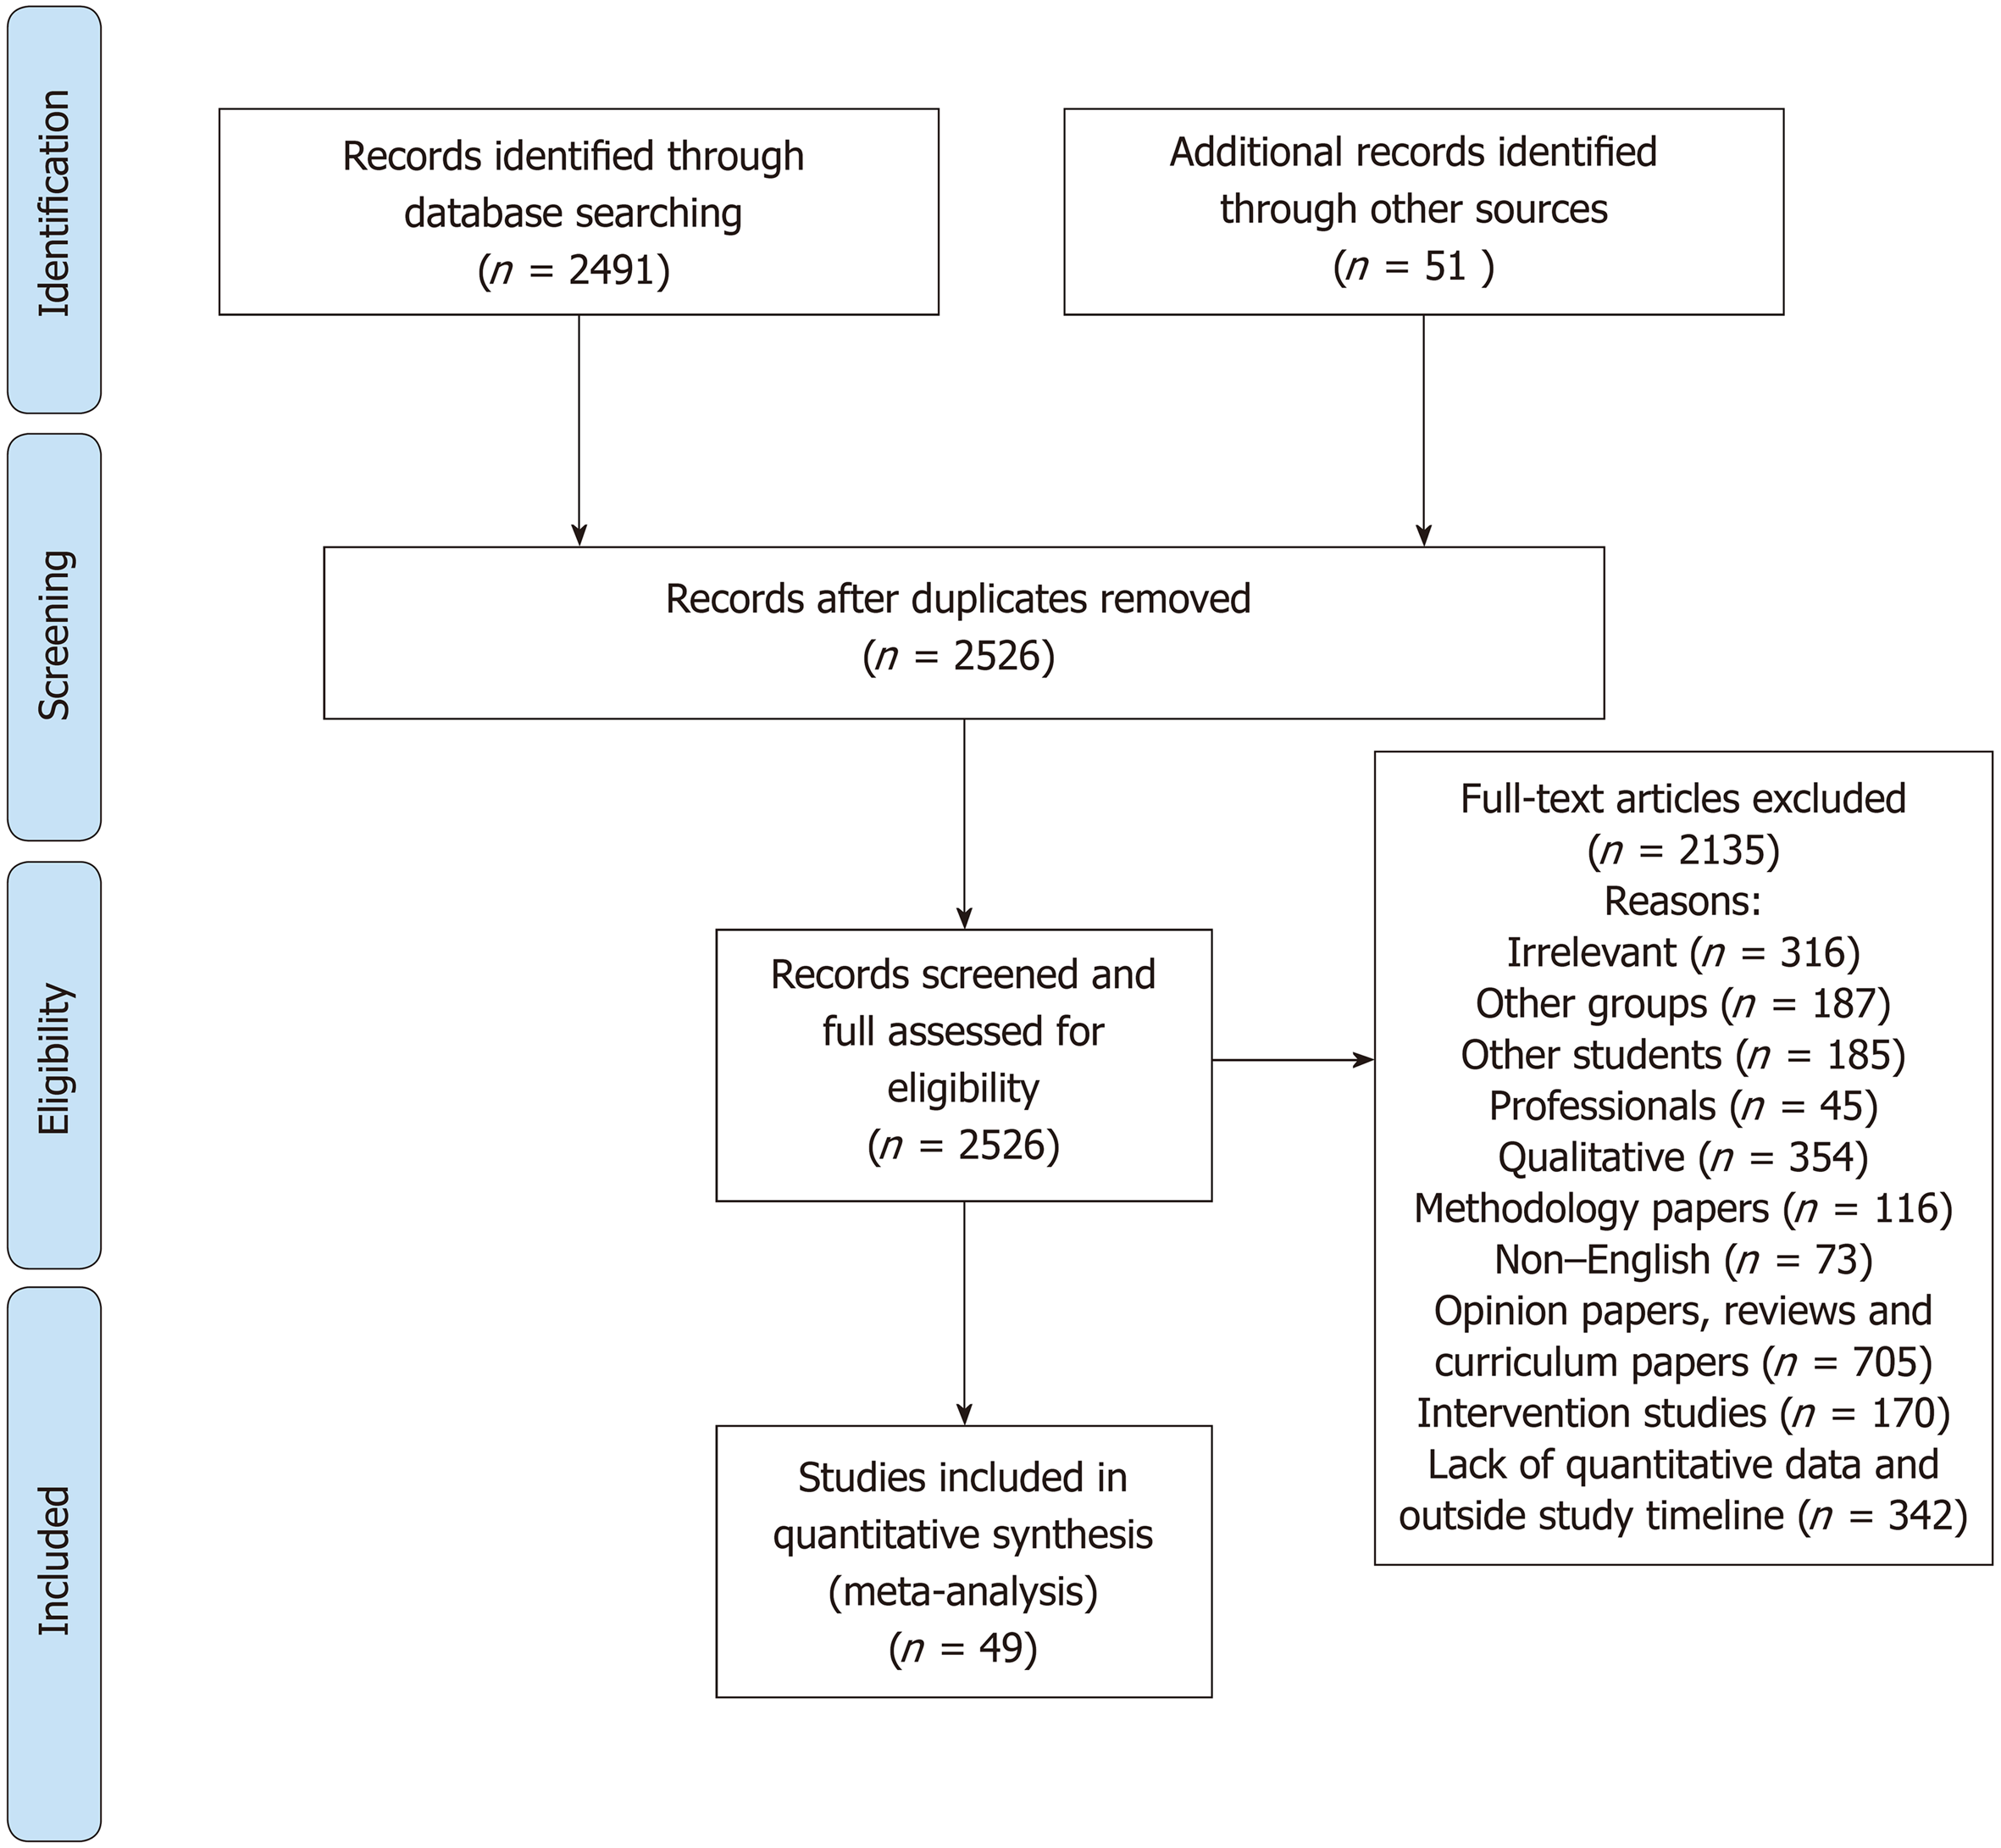
Figure 1 Flow chart of study selection.
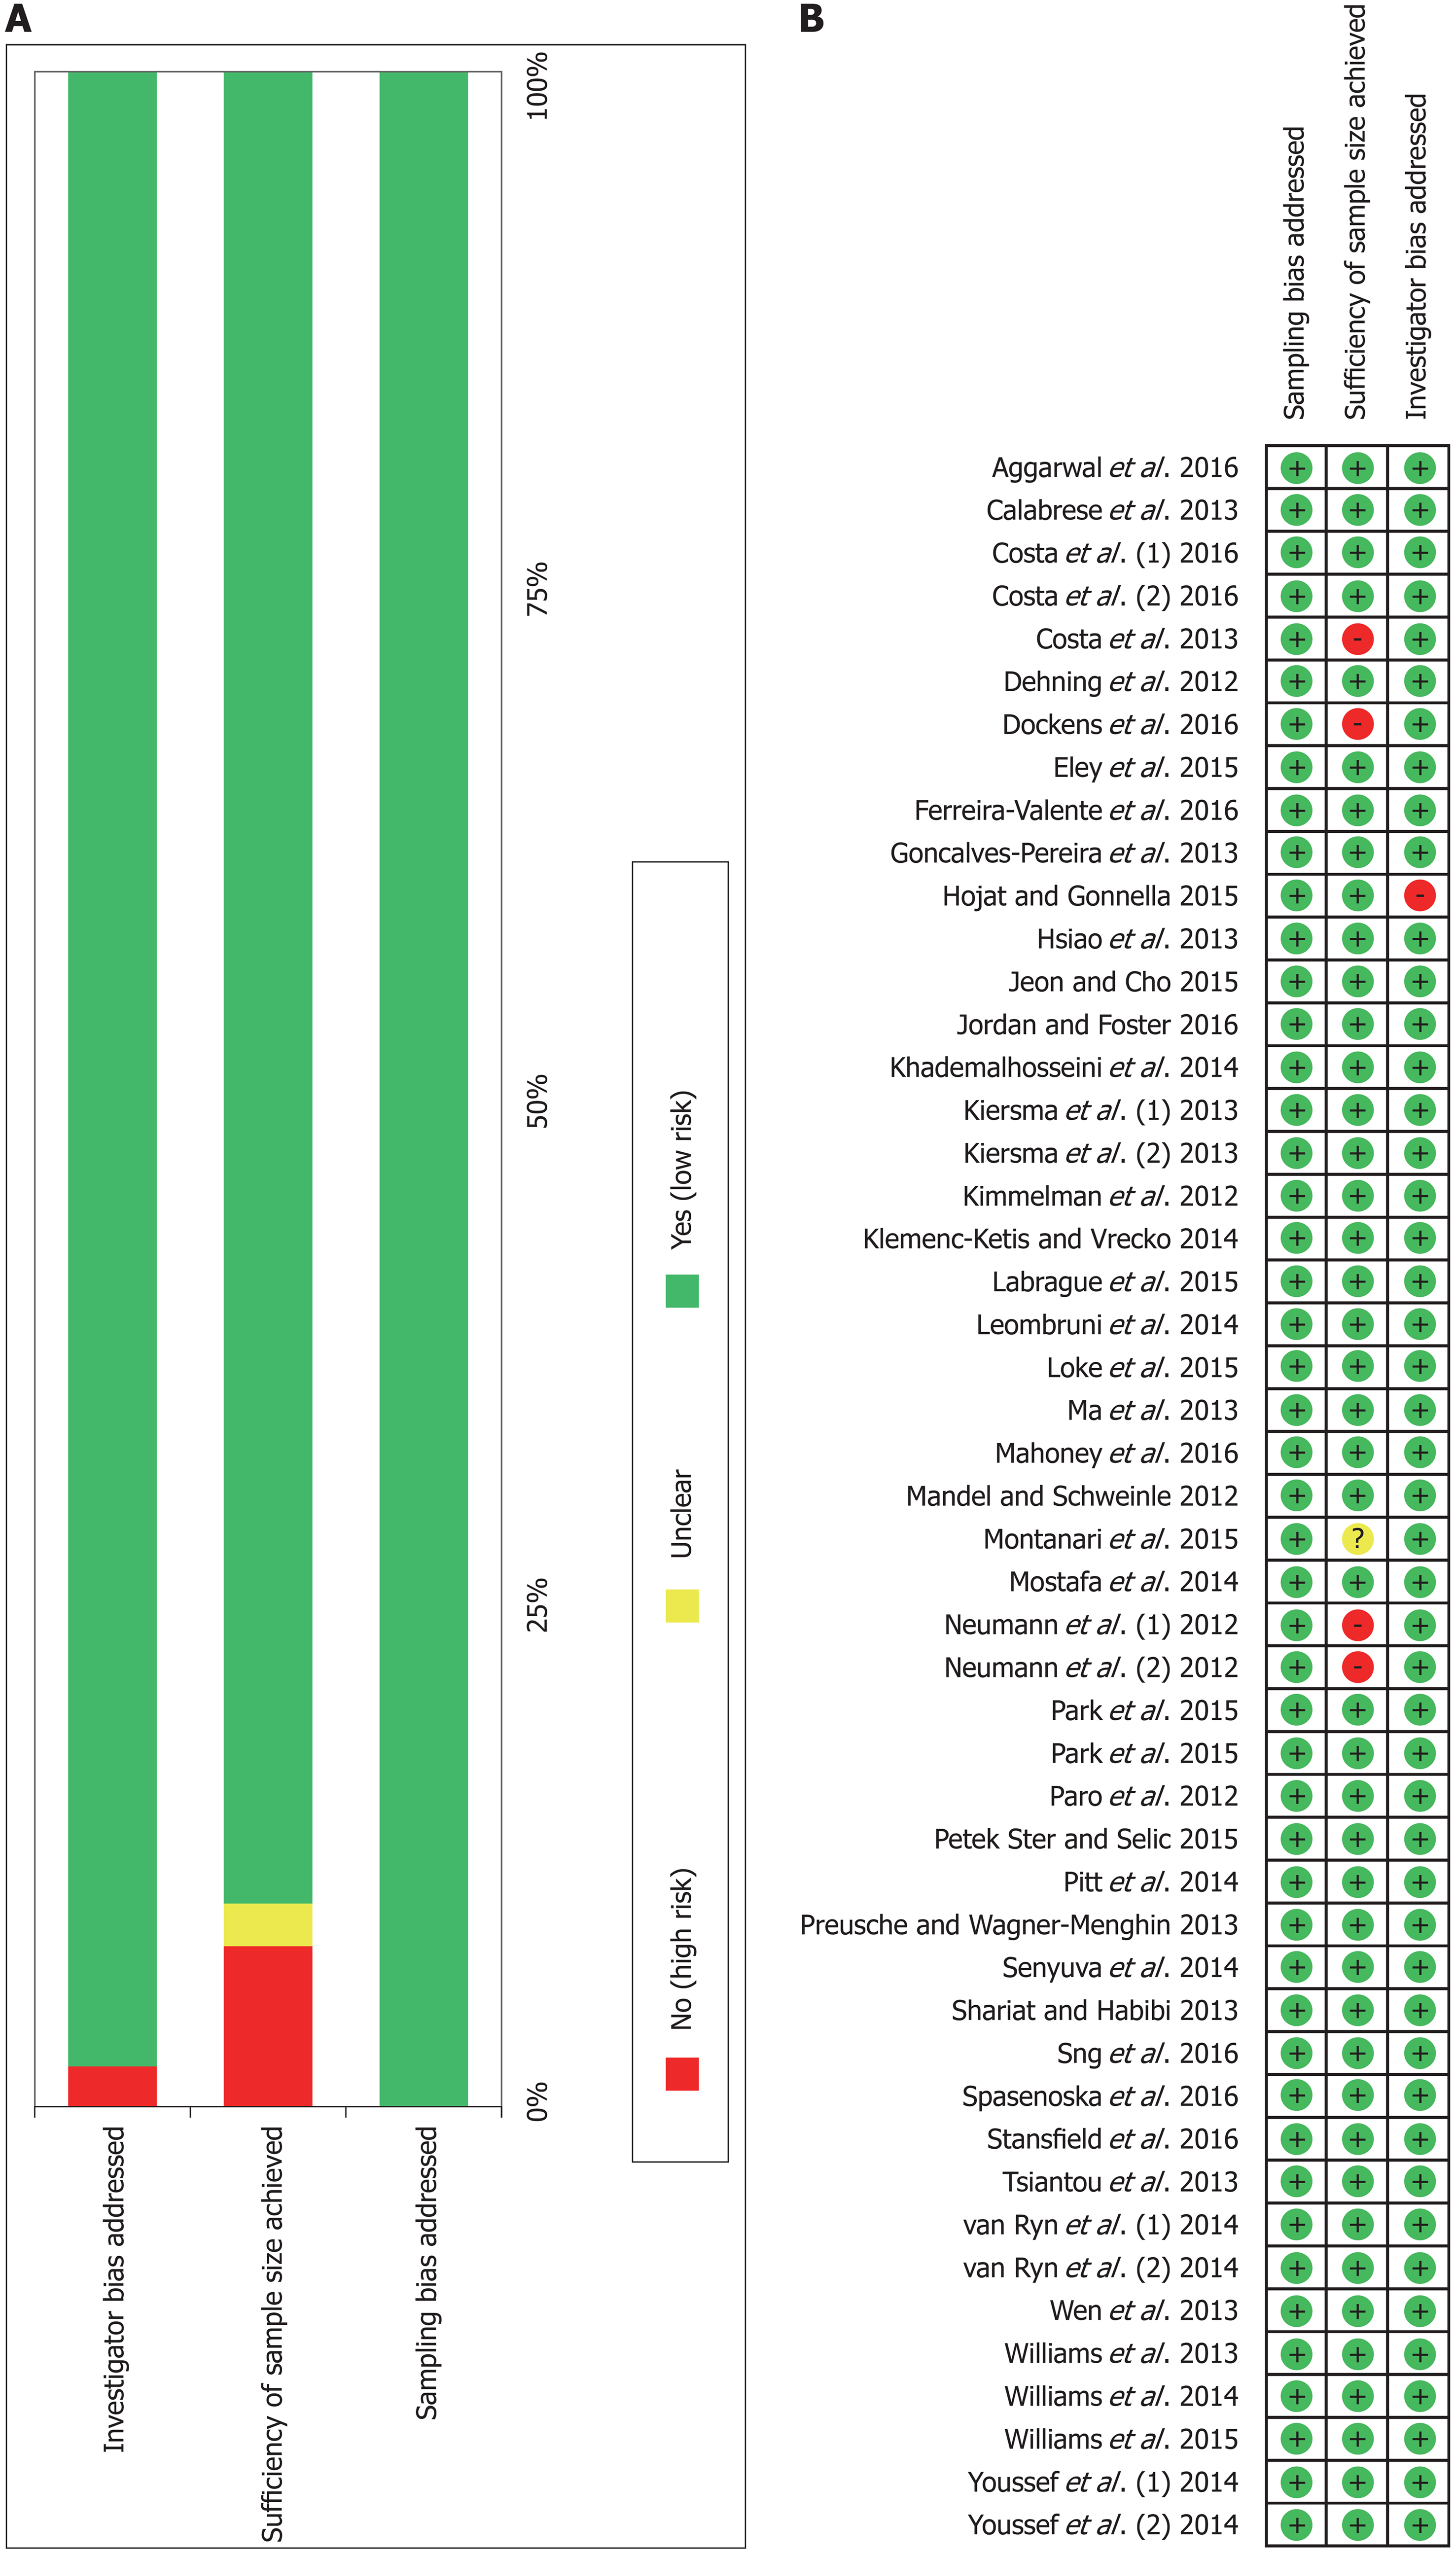
Figure 2 Risk of bias assessment.
A: Risk of bias graph: review authors’ judgements about each risk of bias item presented as percentages across all included studies; B: Risk of bias summary: Review authors’ judgements about each risk of bias item for each included study.
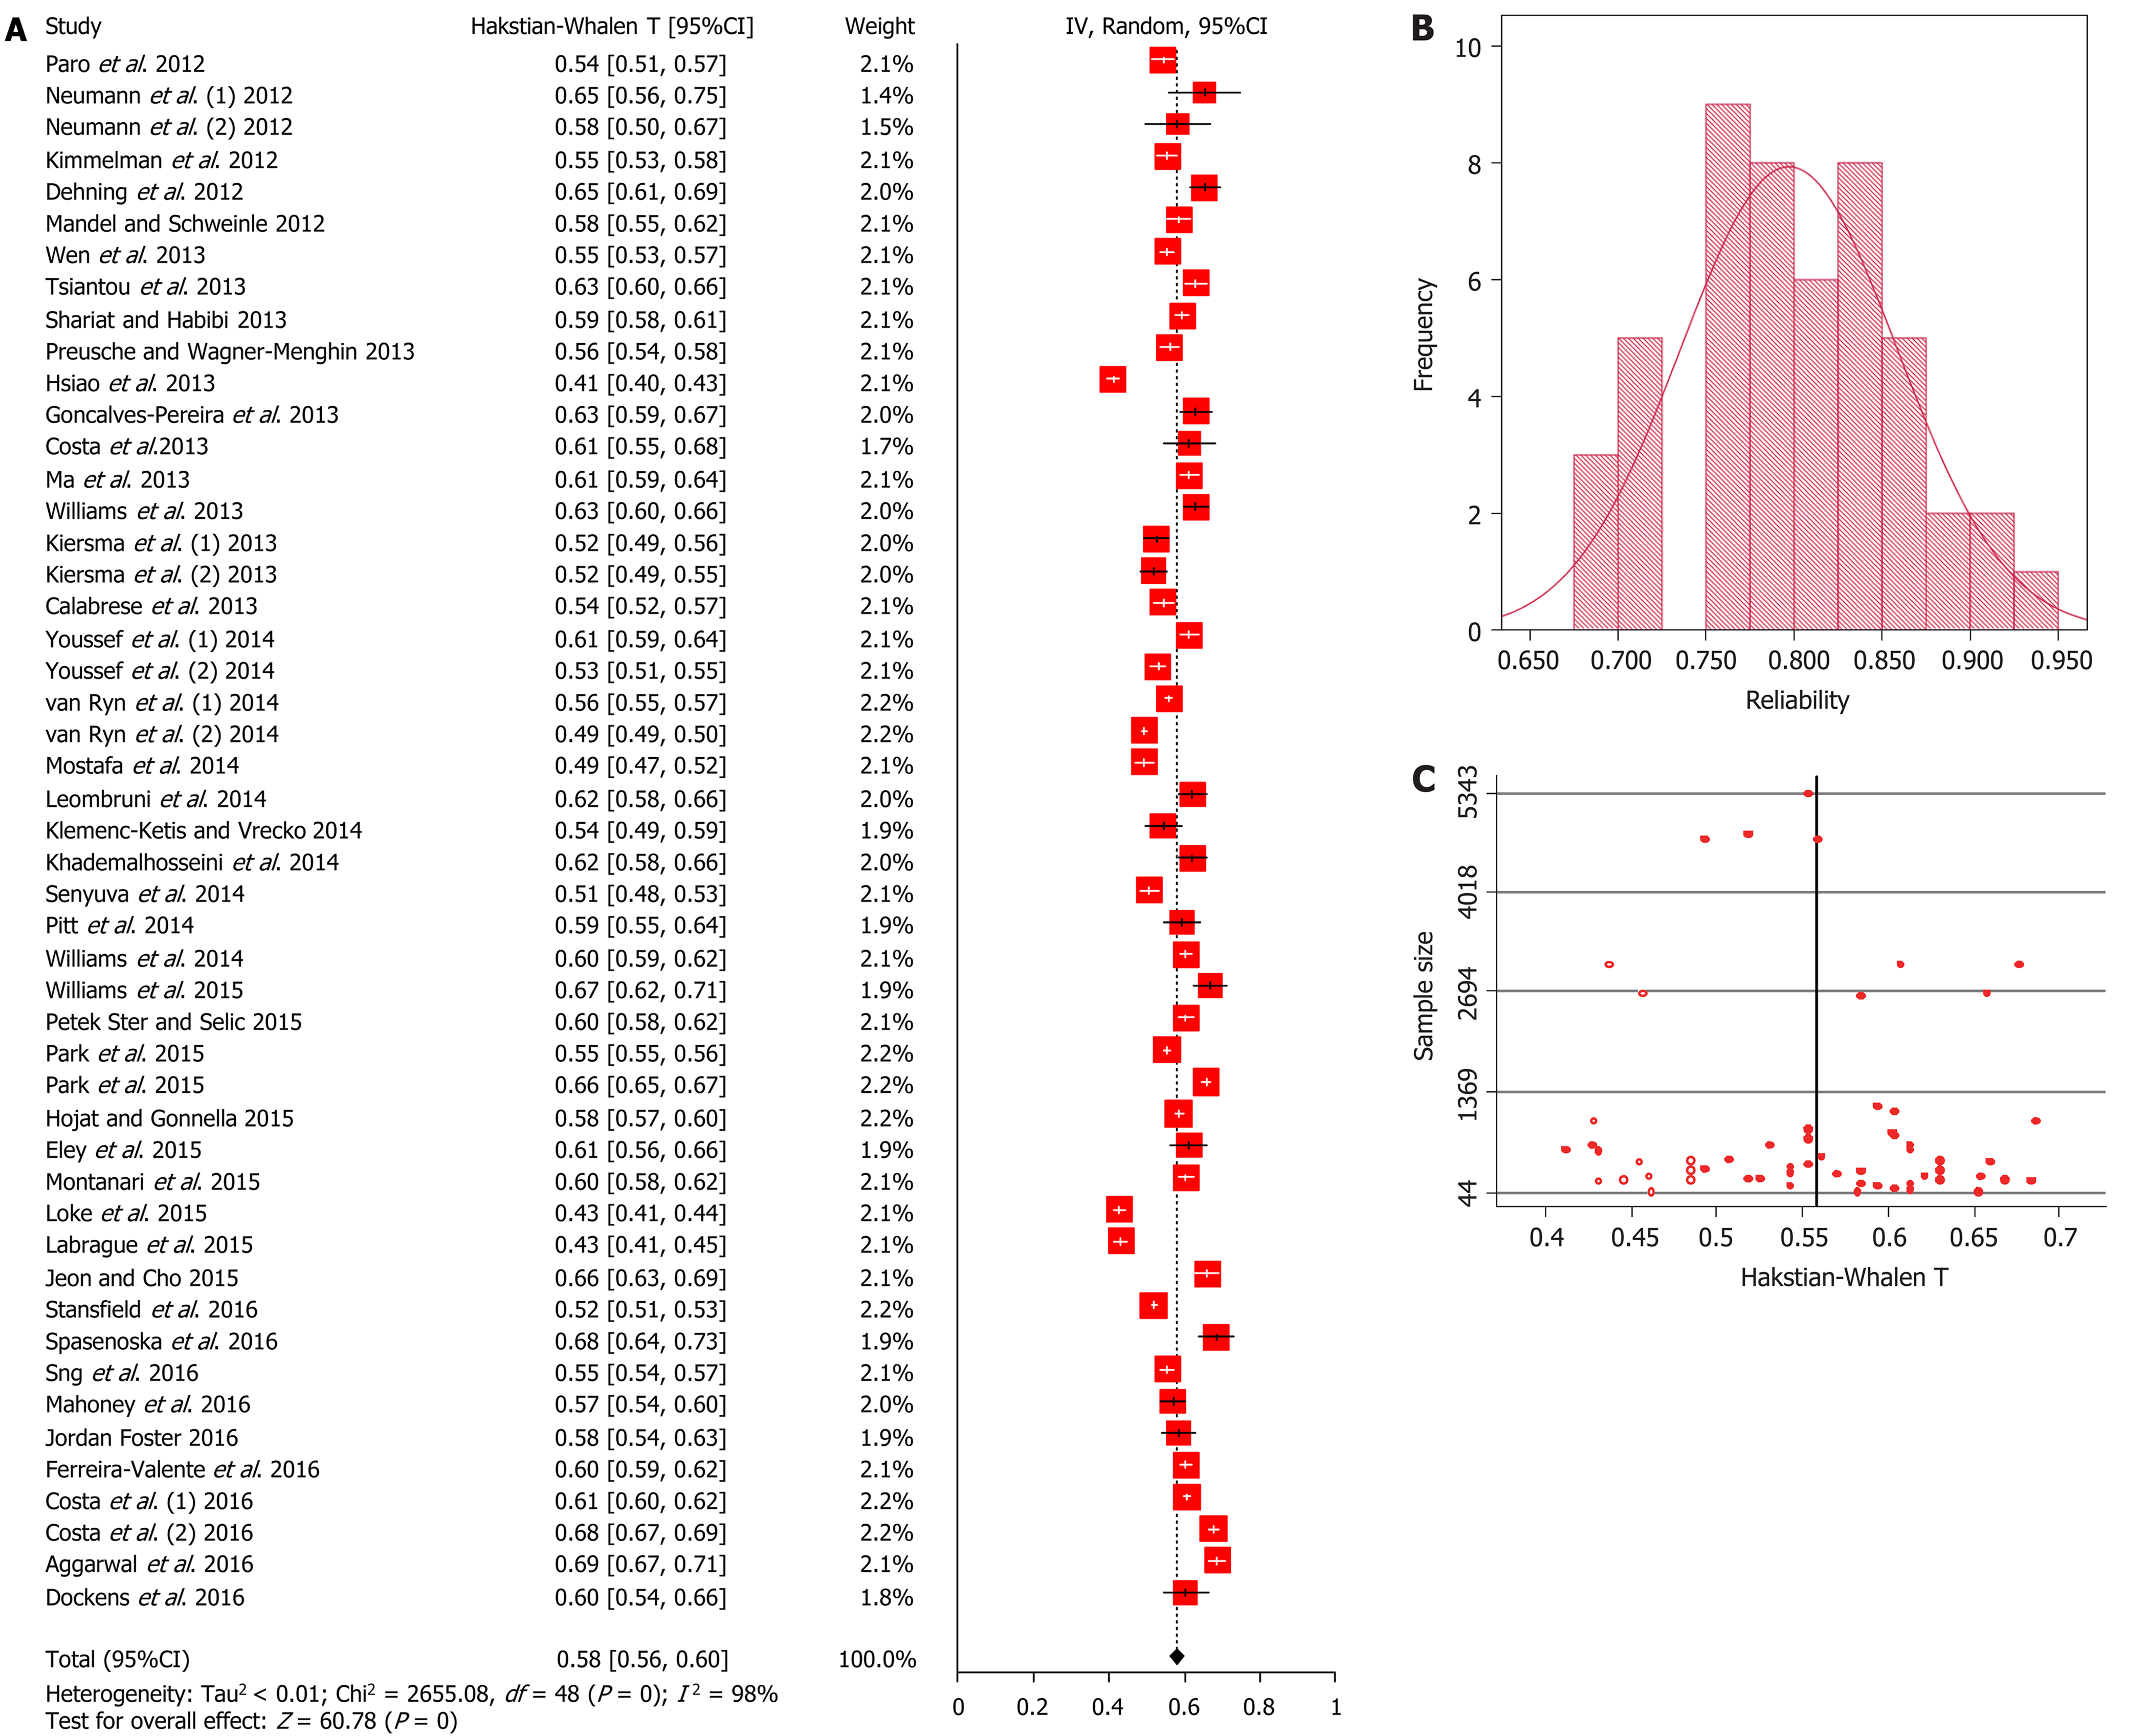
Figure 3 Meta-analysis of Cronbach’s alpha.
A: Forest plot for all studies; B: Distribution of reliabilities (Cronbach’s alpha) in the present study; C: Funnel plot of the effect size against sample size. The empty dots represent the studies from the trim-and-fill analysis. IV: Inverse variance.
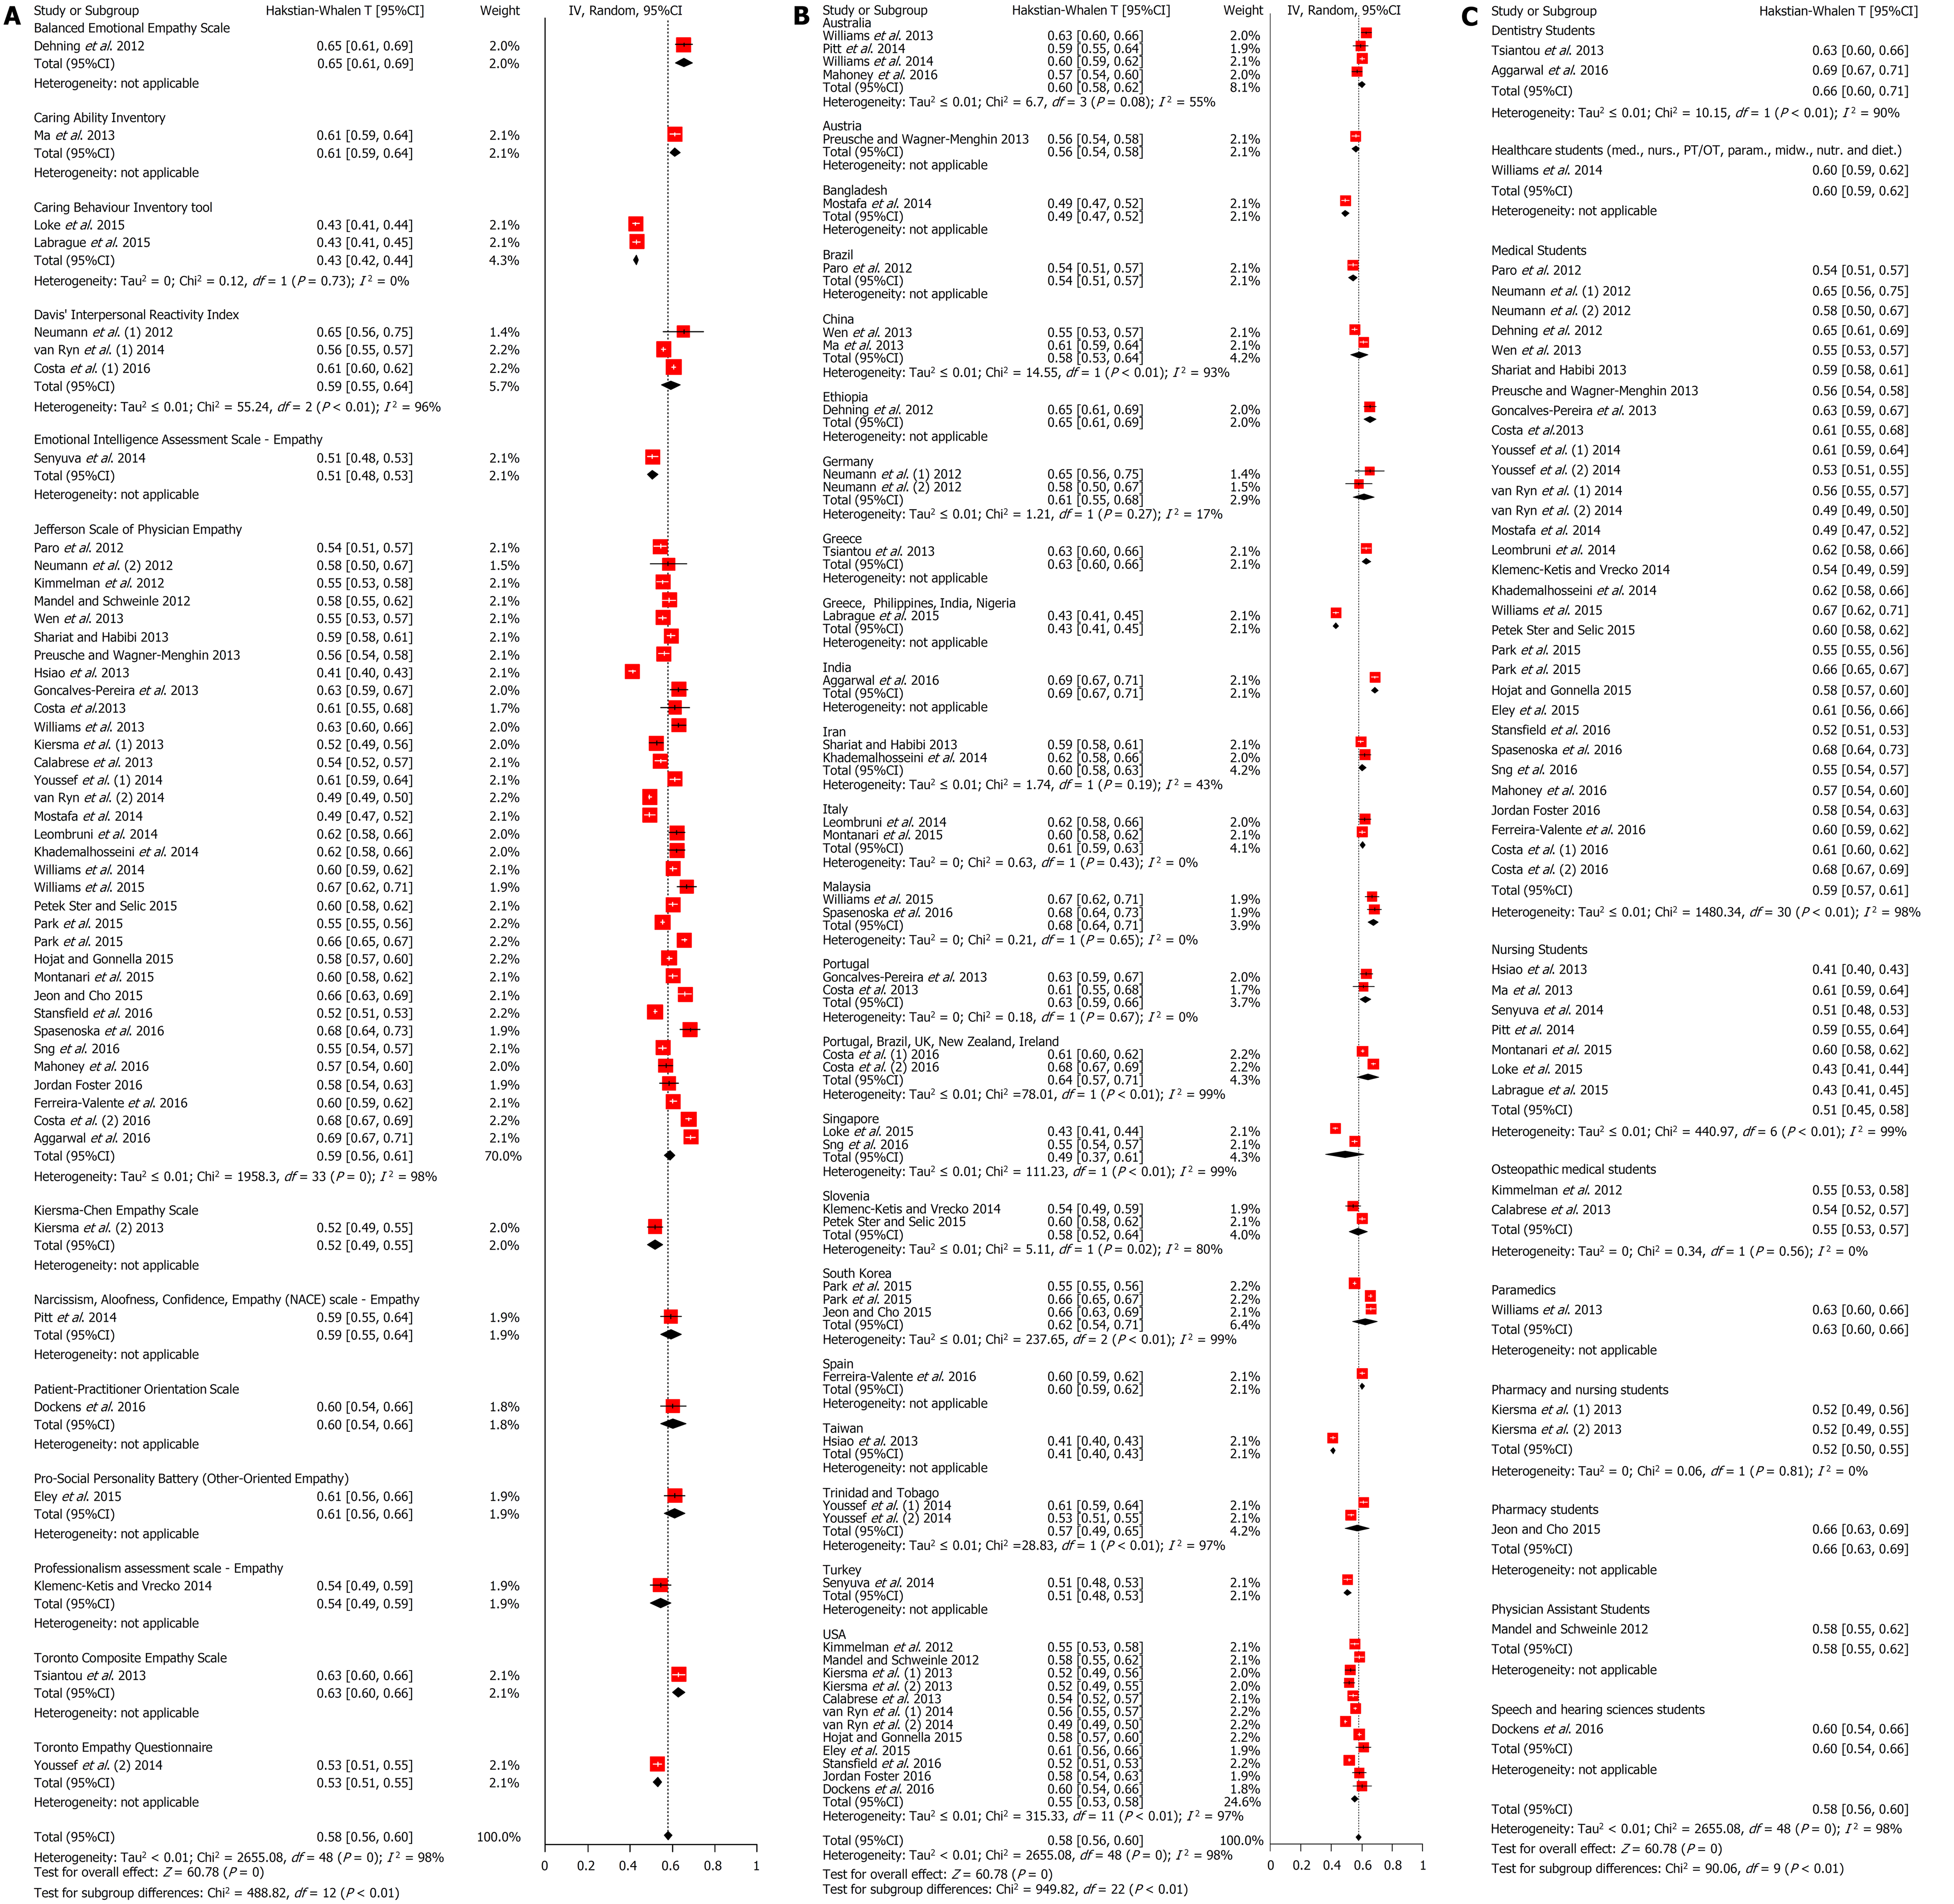
Figure 4 Subgroup analyses.
A: Forest plot according to scale; B: Forest plot according to country; C: Forest plot according to field of study. IV: Inverse variance.
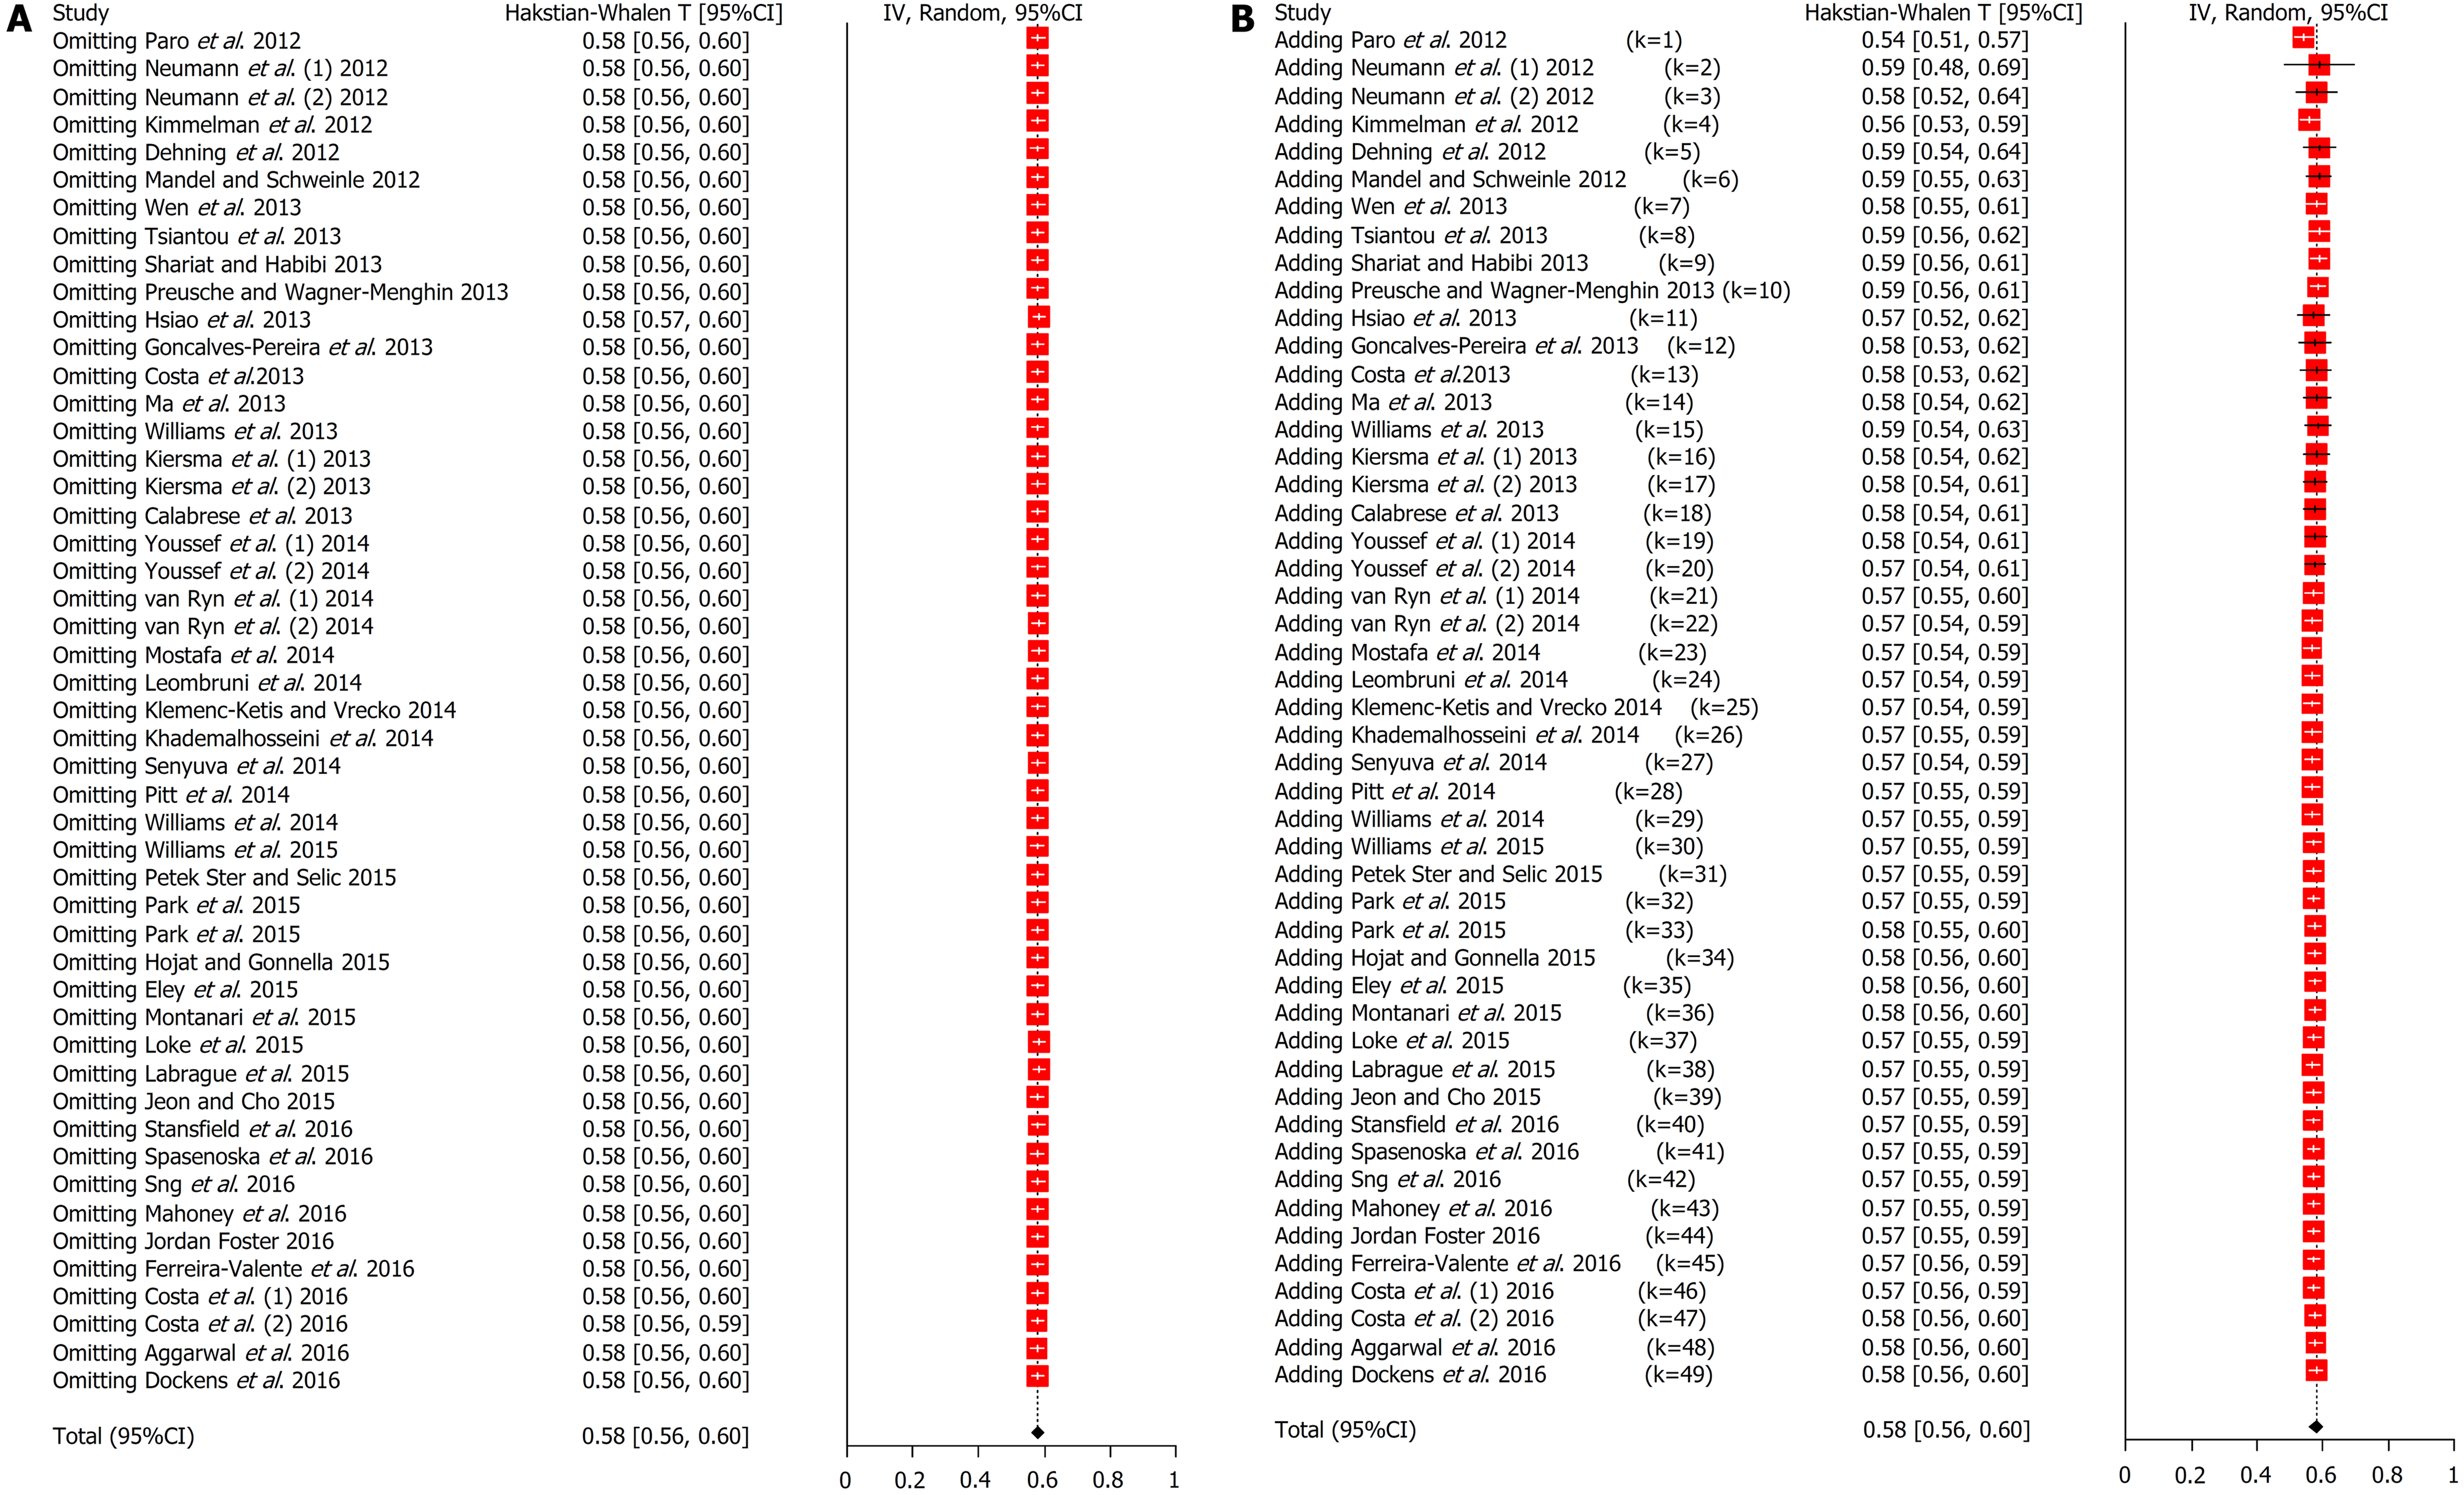
Figure 5 Sensitivity analysis and cumulative meta-analysis.
A: Forest plot for sensitivity meta-analysis; B: Forest plot for cumulative meta-analysis. IV: Inverse variance.
- Citation: Fragkos KC, Sotiropoulos I, Frangos CC. Empathy assessment in healthcare students is highly heterogeneous: A systematic review and meta-analysis (2012-2016). World J Meta-Anal 2019; 7(1): 1-30
- URL: https://www.wjgnet.com/2308-3840/full/v7/i1/1.htm
- DOI: https://dx.doi.org/10.13105/wjma.v7.i1.1


