Copyright
©The Author(s) 2017.
World J Meta-Anal. Apr 26, 2017; 5(2): 54-62
Published online Apr 26, 2017. doi: 10.13105/wjma.v5.i2.54
Published online Apr 26, 2017. doi: 10.13105/wjma.v5.i2.54
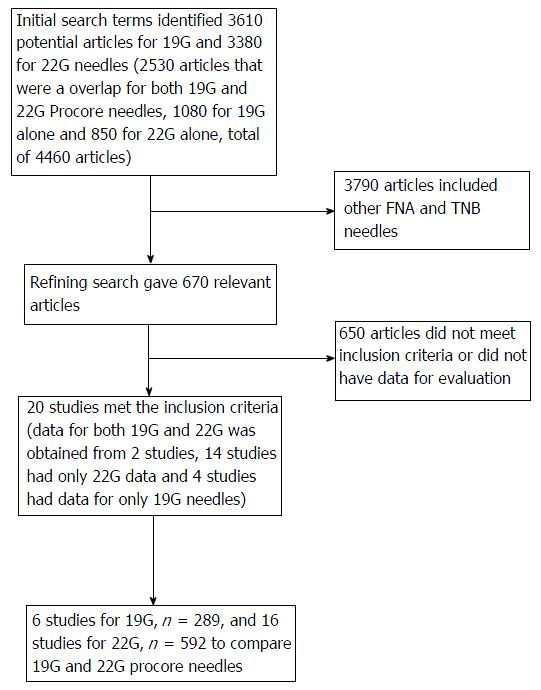
Figure 1 Flow chart showing search results and study selection.
FNA: Fine needle aspiration; TNB: Trucut needle biopsy.
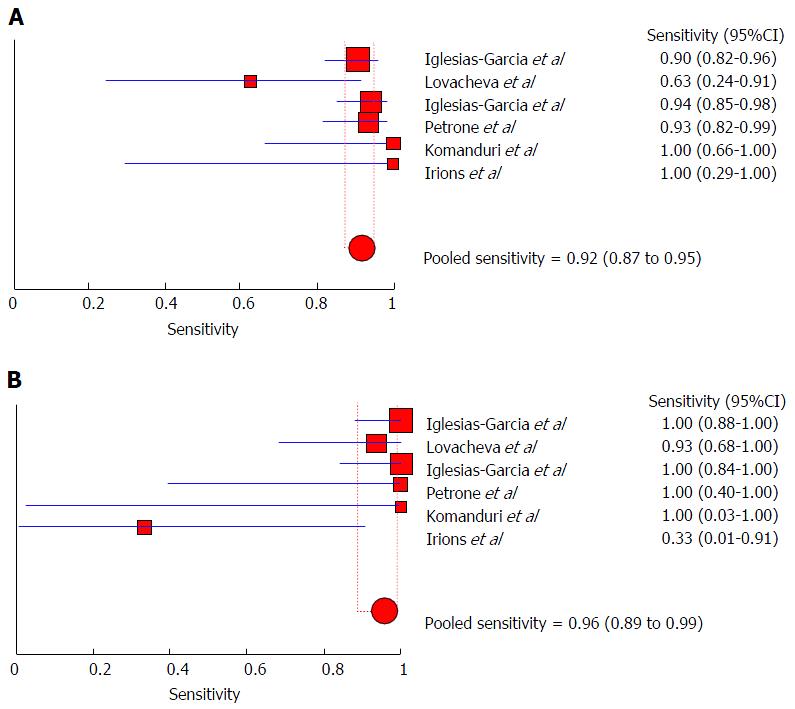
Figure 2 Forest plot showing sensitivity (A) and specificity (B) of 19G Procore needle.
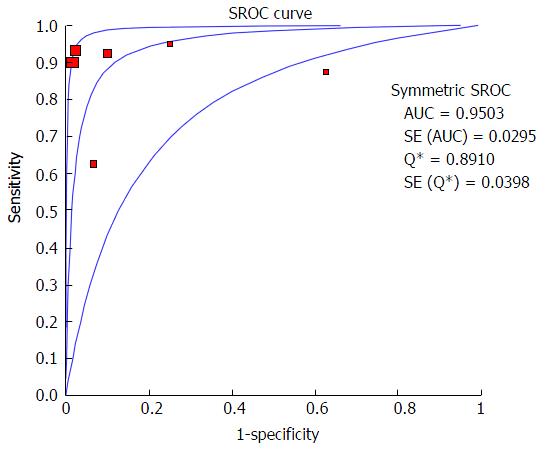
Figure 3 Summary receiver operating characteristic curves for endoscopic ultrasonography 19G core biopsies to diagnose solid lesions.
SROC: Summary receiver operating characteristic; AUC: Area under the curve.
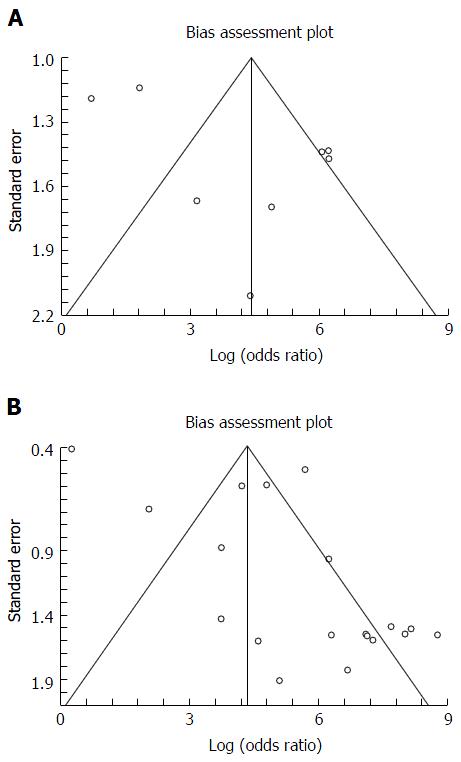
Figure 4 Bias assessment plot for 19G (A) and 22G (B) Procore needle.
- Citation: Kandula M, Bechtold ML, Verma K, Aulakh BS, Taneja D, Puli SR. Is there a difference between 19G core biopsy needle and 22G core biopsy needle in diagnosing the correct etiology? - A meta-analysis and systematic review. World J Meta-Anal 2017; 5(2): 54-62
- URL: https://www.wjgnet.com/2308-3840/full/v5/i2/54.htm
- DOI: https://dx.doi.org/10.13105/wjma.v5.i2.54


