Copyright
©The Author(s) 2016.
World J Meta-Anal. Oct 26, 2016; 4(5): 105-117
Published online Oct 26, 2016. doi: 10.13105/wjma.v4.i5.105
Published online Oct 26, 2016. doi: 10.13105/wjma.v4.i5.105
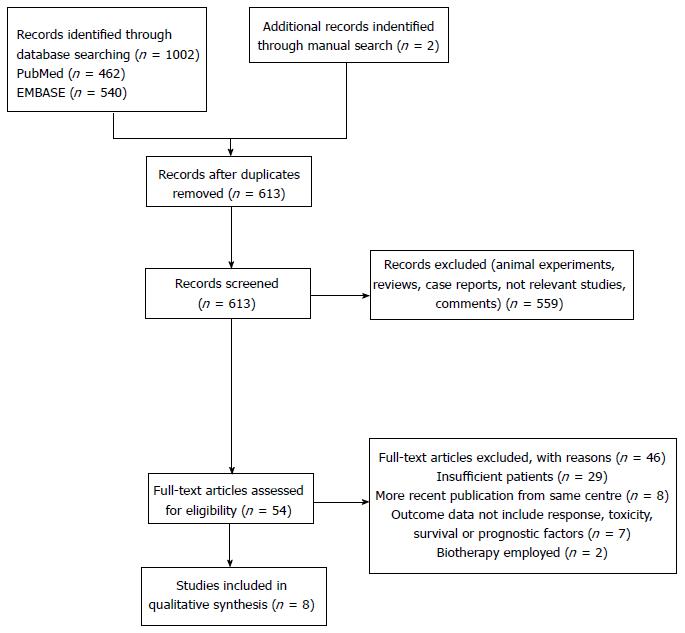
Figure 1 Literature search PRIMSA flow diagram.
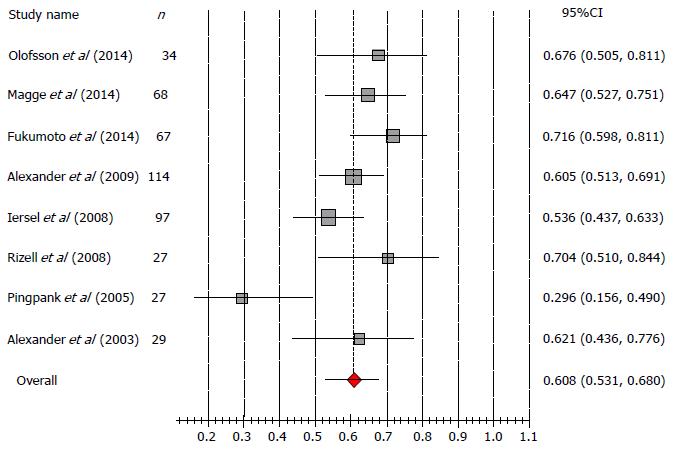
Figure 2 Forest plot of the studies for response rate.
Pooled estimate (%) = 60.8%, 95%CI: 53.1%-68.0%, I2 = 37.1%.
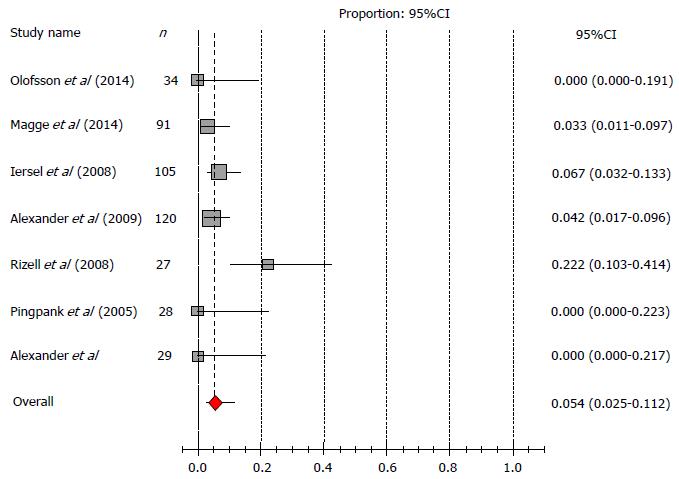
Figure 3 Forest plot of the studies for mortality.
Pooled estimate (%) = 5.4%, 95%CI: 2.5%-11.2%, I2 = 37.5%.
Figure 4 Forest plot of the relative risk of overall survival for different gender.
Figure 5 Forest plot of the relative risk of overall survival for different preoperative carcino-embryonic antigen levels.
CEA: Carcino embryonic antigen.
- Citation: Meng T, Li GQ, Dai MH. Isolated hepatic perfusion for unresectable hepatic malignancies: A systematic review and meta-analysis. World J Meta-Anal 2016; 4(5): 105-117
- URL: https://www.wjgnet.com/2308-3840/full/v4/i5/105.htm
- DOI: https://dx.doi.org/10.13105/wjma.v4.i5.105


