Copyright
©The Author(s) 2015.
World J Meta-Anal. Dec 26, 2015; 3(6): 295-303
Published online Dec 26, 2015. doi: 10.13105/wjma.v3.i6.295
Published online Dec 26, 2015. doi: 10.13105/wjma.v3.i6.295
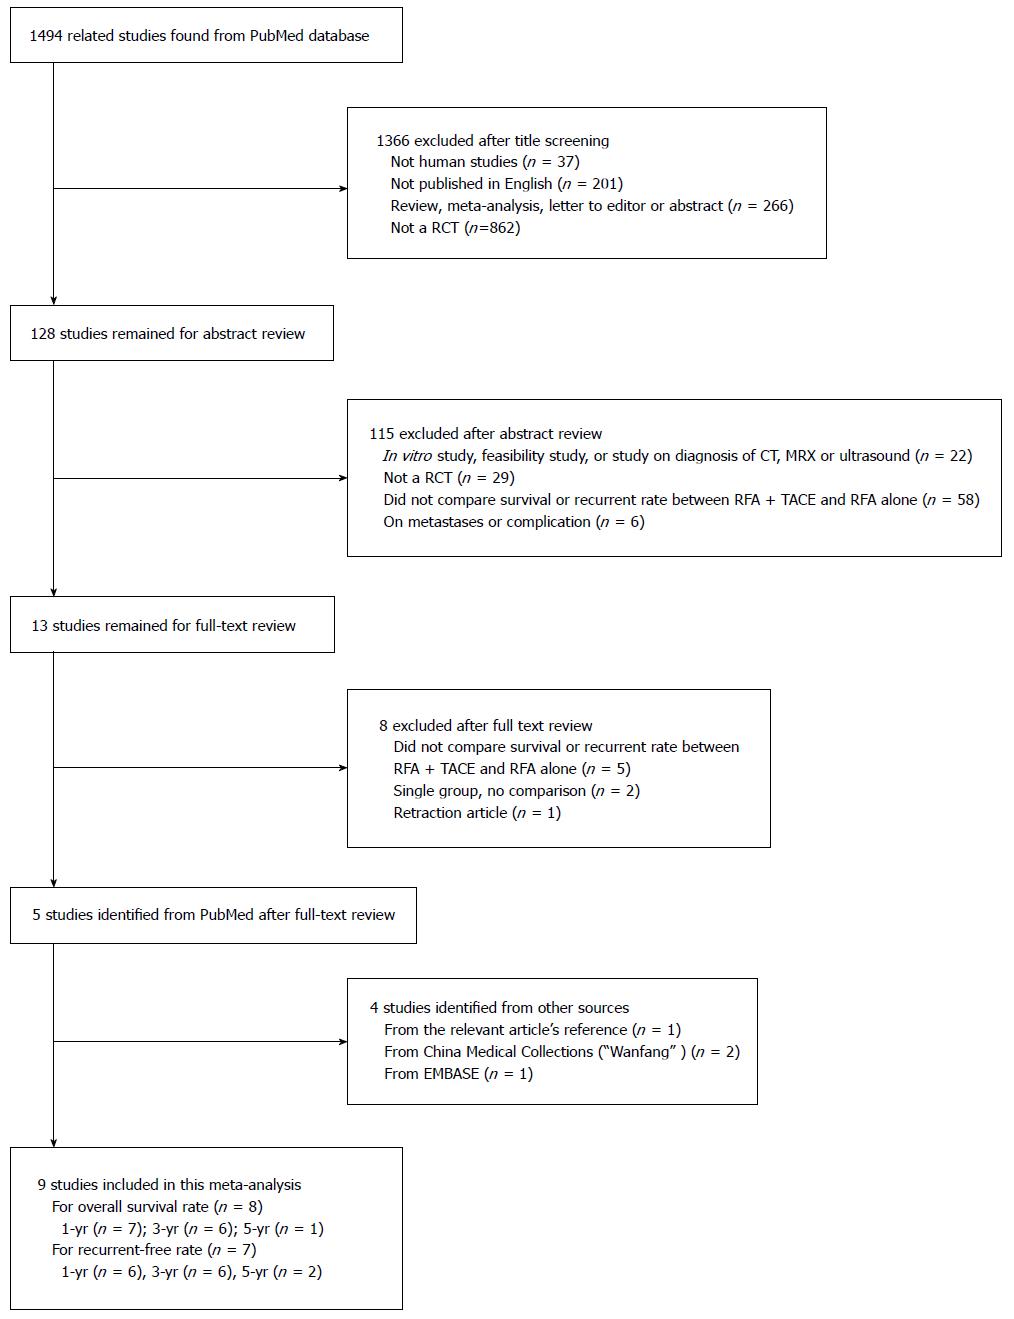
Figure 1 Flow chart of study screening and selection.
RCT: Randomized clinical trial; TACE: Transarterial chemoembolization; RFA: Radiofrequency ablation; CT: Computed tomography; MRX: Magnetic resonance, soft spectrum coupled X-ray laser.
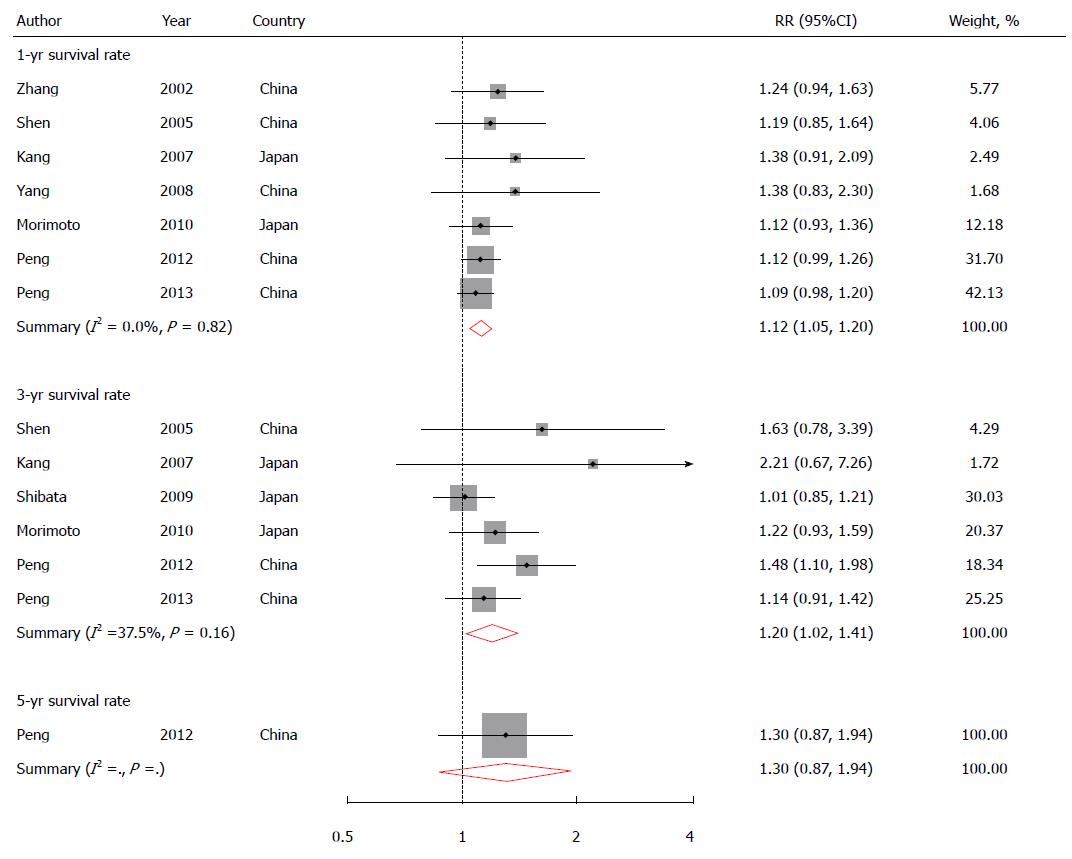
Figure 2 Relative risks and 95%CIs for risk of overall survival rate of hepatocellular carcinoma comparing combined therapy (radiofrequency ablation/transarterial chemoembolization) with radiofrequency ablation alone.
The overall estimates were obtained by using a random-effects model. The dots indicate the RRs. The size of the shaded square is proportional to the weight of each study. The horizontal lines represent 95%CIs. The diamond data markers indicate the summary RRs. RRs: Relative risks.
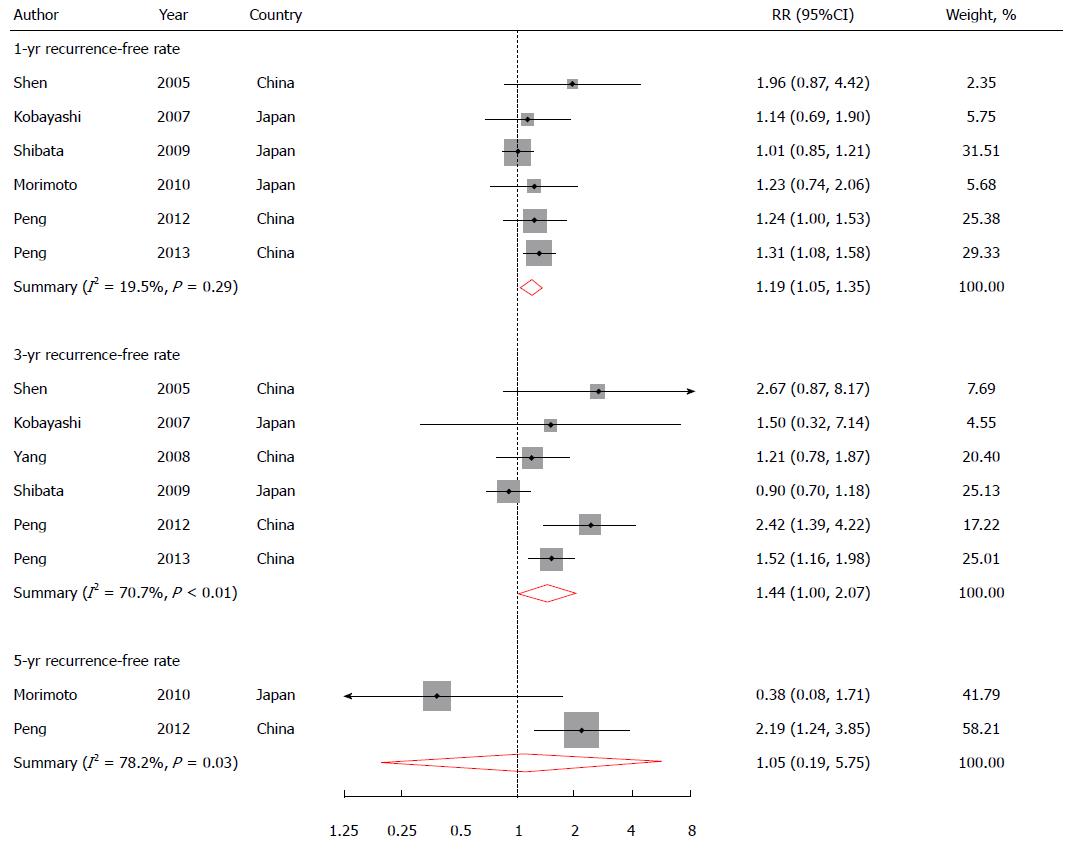
Figure 3 Relative risks and 95%CIs for risk of radiofrequency ablation rate of hepatocellular carcinoma comparing combined therapy (radiofrequency ablation/transarterial chemoembolization) with radiofrequency ablation alone.
The overall estimates were obtained by using a random-effects model. The dots indicate the RRs. The size of the shaded square is proportional to the weight of each study. The horizontal lines represent 95%CIs. The diamond data markers indicate the RRs. RRs: Relative risks.
- Citation: Hu MZ, Li SF. Radiofrequency ablation with or without transarterial chemoembolization for hepatocellular carcinoma: A systematic review and meta-analysis. World J Meta-Anal 2015; 3(6): 295-303
- URL: https://www.wjgnet.com/2308-3840/full/v3/i6/295.htm
- DOI: https://dx.doi.org/10.13105/wjma.v3.i6.295


