Copyright
©The Author(s) 2015.
World J Meta-Anal. Jun 26, 2015; 3(3): 181-187
Published online Jun 26, 2015. doi: 10.13105/wjma.v3.i3.181
Published online Jun 26, 2015. doi: 10.13105/wjma.v3.i3.181
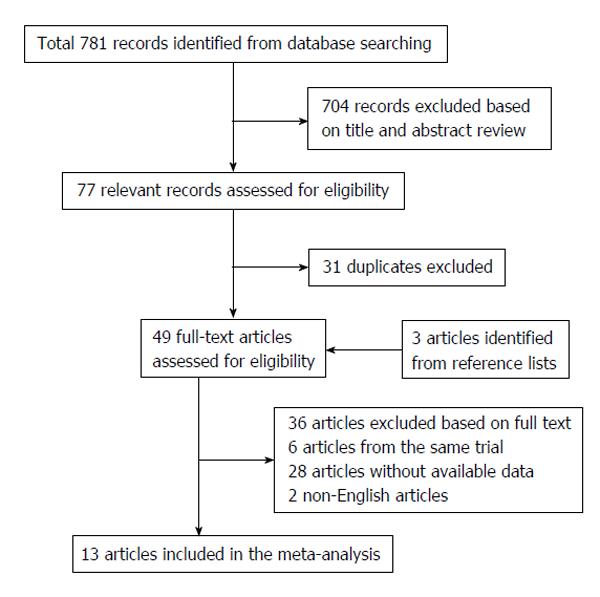
Figure 1 Flow diagram of the study selection process.
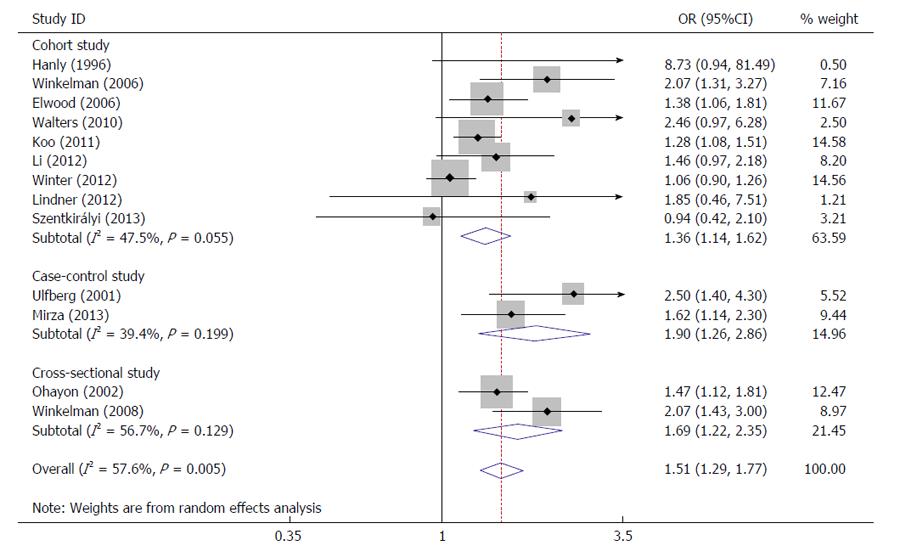
Figure 2 Forest plot (random effects model) of overall cardiovascular disease risk associated with sleep-associated movement disorders.
Figure 3 Forest plot (fixed effects model) of overall cardiovascular disease risk associated with restless legs syndrome.
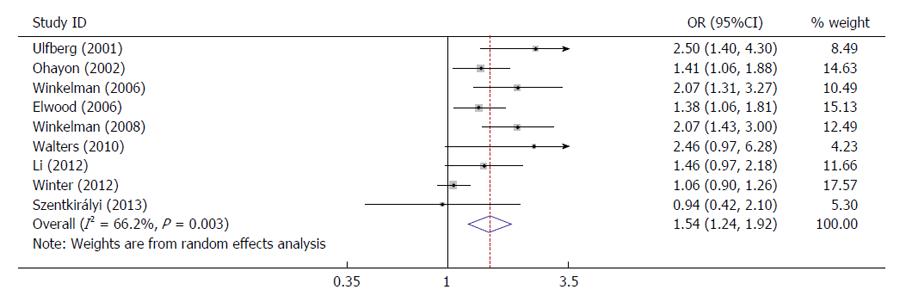
Figure 4 Forest plot (random effects model) of overall coronary artery disease risk associated with sleep-associated movement disorders.
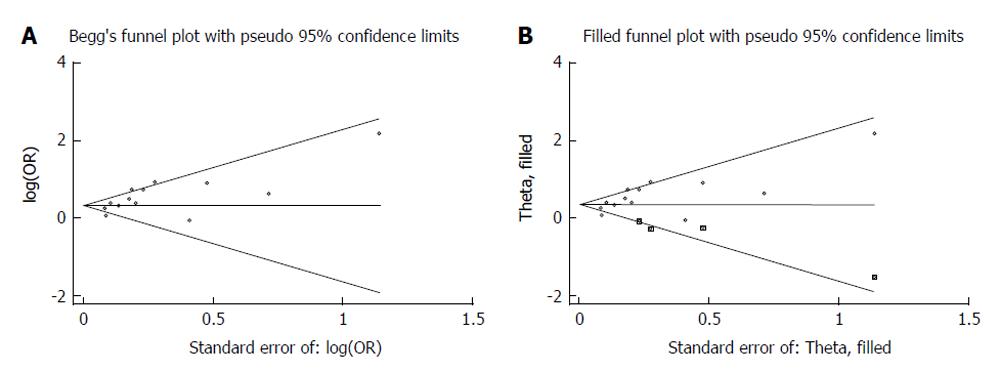
Figure 5 Funnel plots without and with trim and fill.
A: Funnel plot without trim and fill; B: Funnel plot with trim and fill.
- Citation: Fang Z, Liu YW, Zhao LY, Xu Y, Zhang FX. Sleep-associated movement disorders and the risk of cardiovascular disease: A systematic review and meta-analysis. World J Meta-Anal 2015; 3(3): 181-187
- URL: https://www.wjgnet.com/2308-3840/full/v3/i3/181.htm
- DOI: https://dx.doi.org/10.13105/wjma.v3.i3.181


