©2014 Baishideng Publishing Group Inc.
World J Meta-Anal. Nov 26, 2014; 2(4): 162-170
Published online Nov 26, 2014. doi: 10.13105/wjma.v2.i4.162
Published online Nov 26, 2014. doi: 10.13105/wjma.v2.i4.162
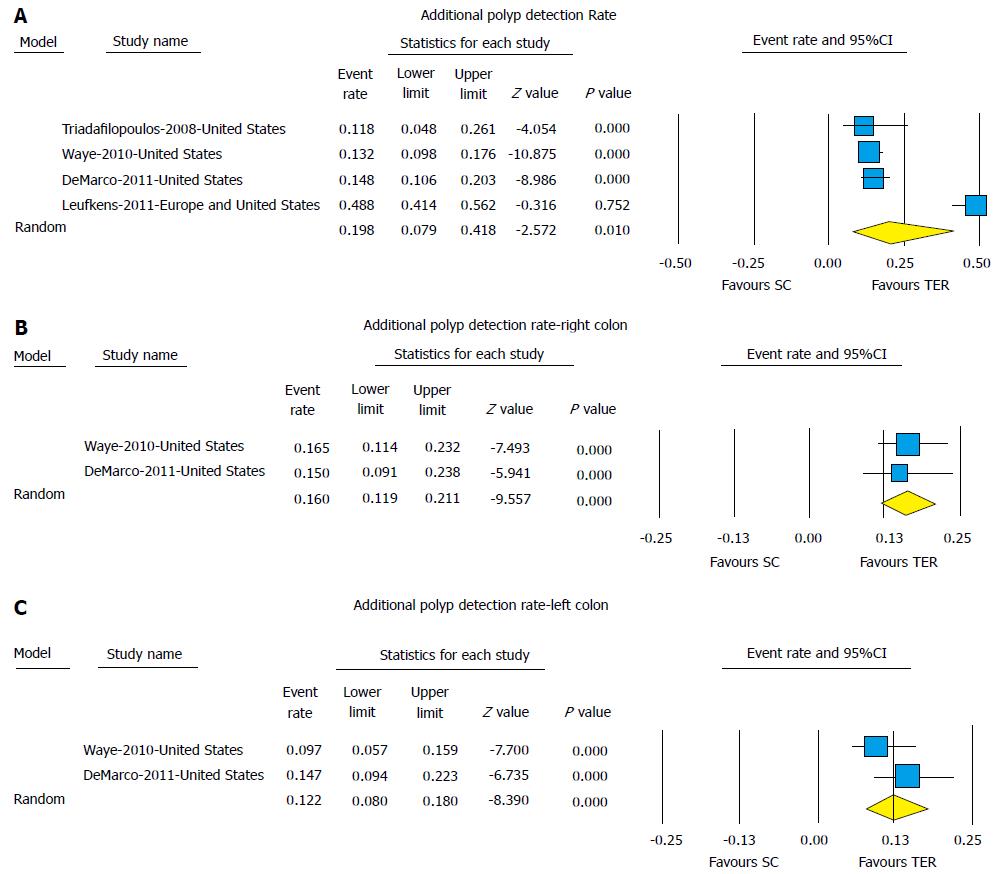
Figure 1 (A) Pooled additional polyp detection rate, (B) additional polyp detection rate-right colon, and (C) additional polyp detection rate-left colon with use of third eye retroscope compared to standard colonoscopy alone.
The size of the each square is proportional to the sample size for each study, and the horizontal lines through the square indicate the 95%CI for that study. For the pooled analysis, the diamond indicated the pooled value and the right and left ends of the diamond indicate the 95%CI for the analysis. TER: Third eye retroscope; SC: Standard colonoscope.
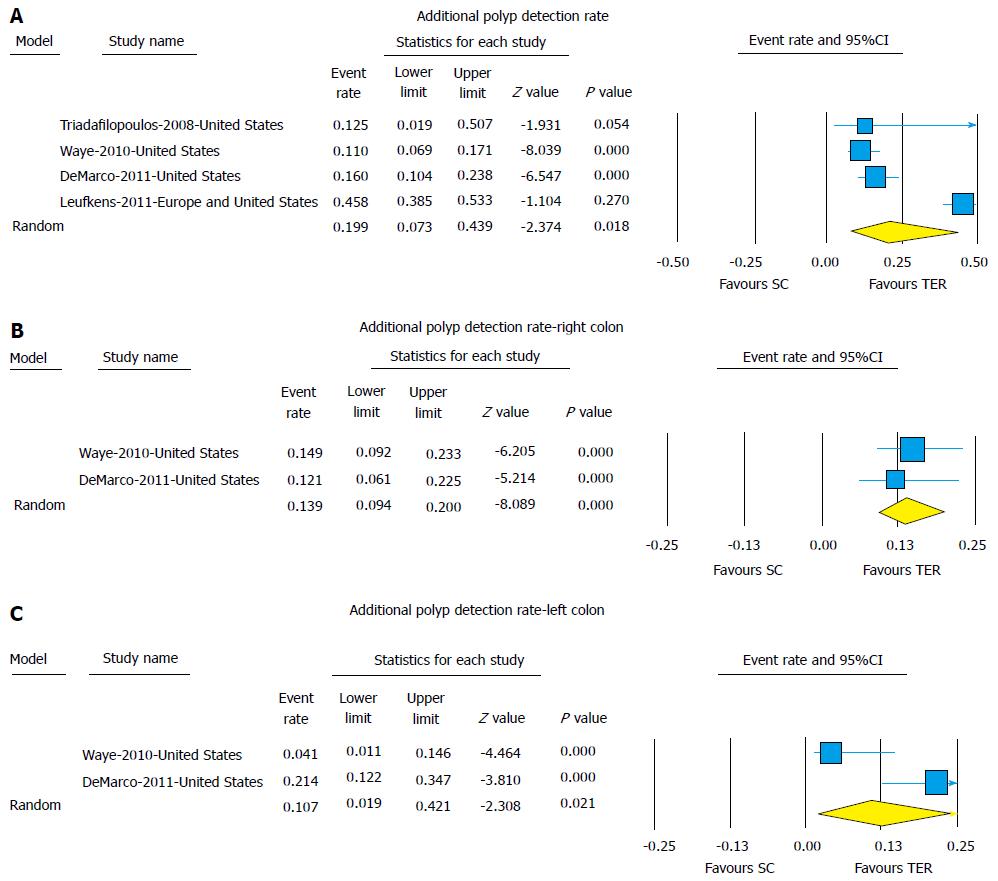
Figure 2 (A) Pooled additional adenoma detection rate, (B) additional adenoma detection rate-right colon, and (C) additional adenoma detection rate-left colon with use of third eye retroscope compared to standard colonoscopy alone.
The size of the each square is proportional to the sample size for each study, and the horizontal lines through the square indicate the 95%CI for that study. For the pooled analysis, the diamond indicated the pooled value and the right and left ends of the diamond indicate the 95%CI for the analysis. TER: Third eye retroscope; SC: Standard colonoscope.
Figure 3 Funnel Plot for publication bias for (A) additional polyp detection rate and (B) additional adenoma detection rate.
- Citation: Thosani N, Rao B, Batra S, Adeyefa B, Raju GS, Bresalier RS, Banerjee S, Guha S. Diagnostic yield of third eye retroscope on adenoma detection during colonoscopy: A systematic review and meta-analysis. World J Meta-Anal 2014; 2(4): 162-170
- URL: https://www.wjgnet.com/2308-3840/full/v2/i4/162.htm
- DOI: https://dx.doi.org/10.13105/wjma.v2.i4.162


