Copyright
©The Author(s) 2022.
World J Meta-Anal. Aug 28, 2022; 10(4): 220-237
Published online Aug 28, 2022. doi: 10.13105/wjma.v10.i4.220
Published online Aug 28, 2022. doi: 10.13105/wjma.v10.i4.220
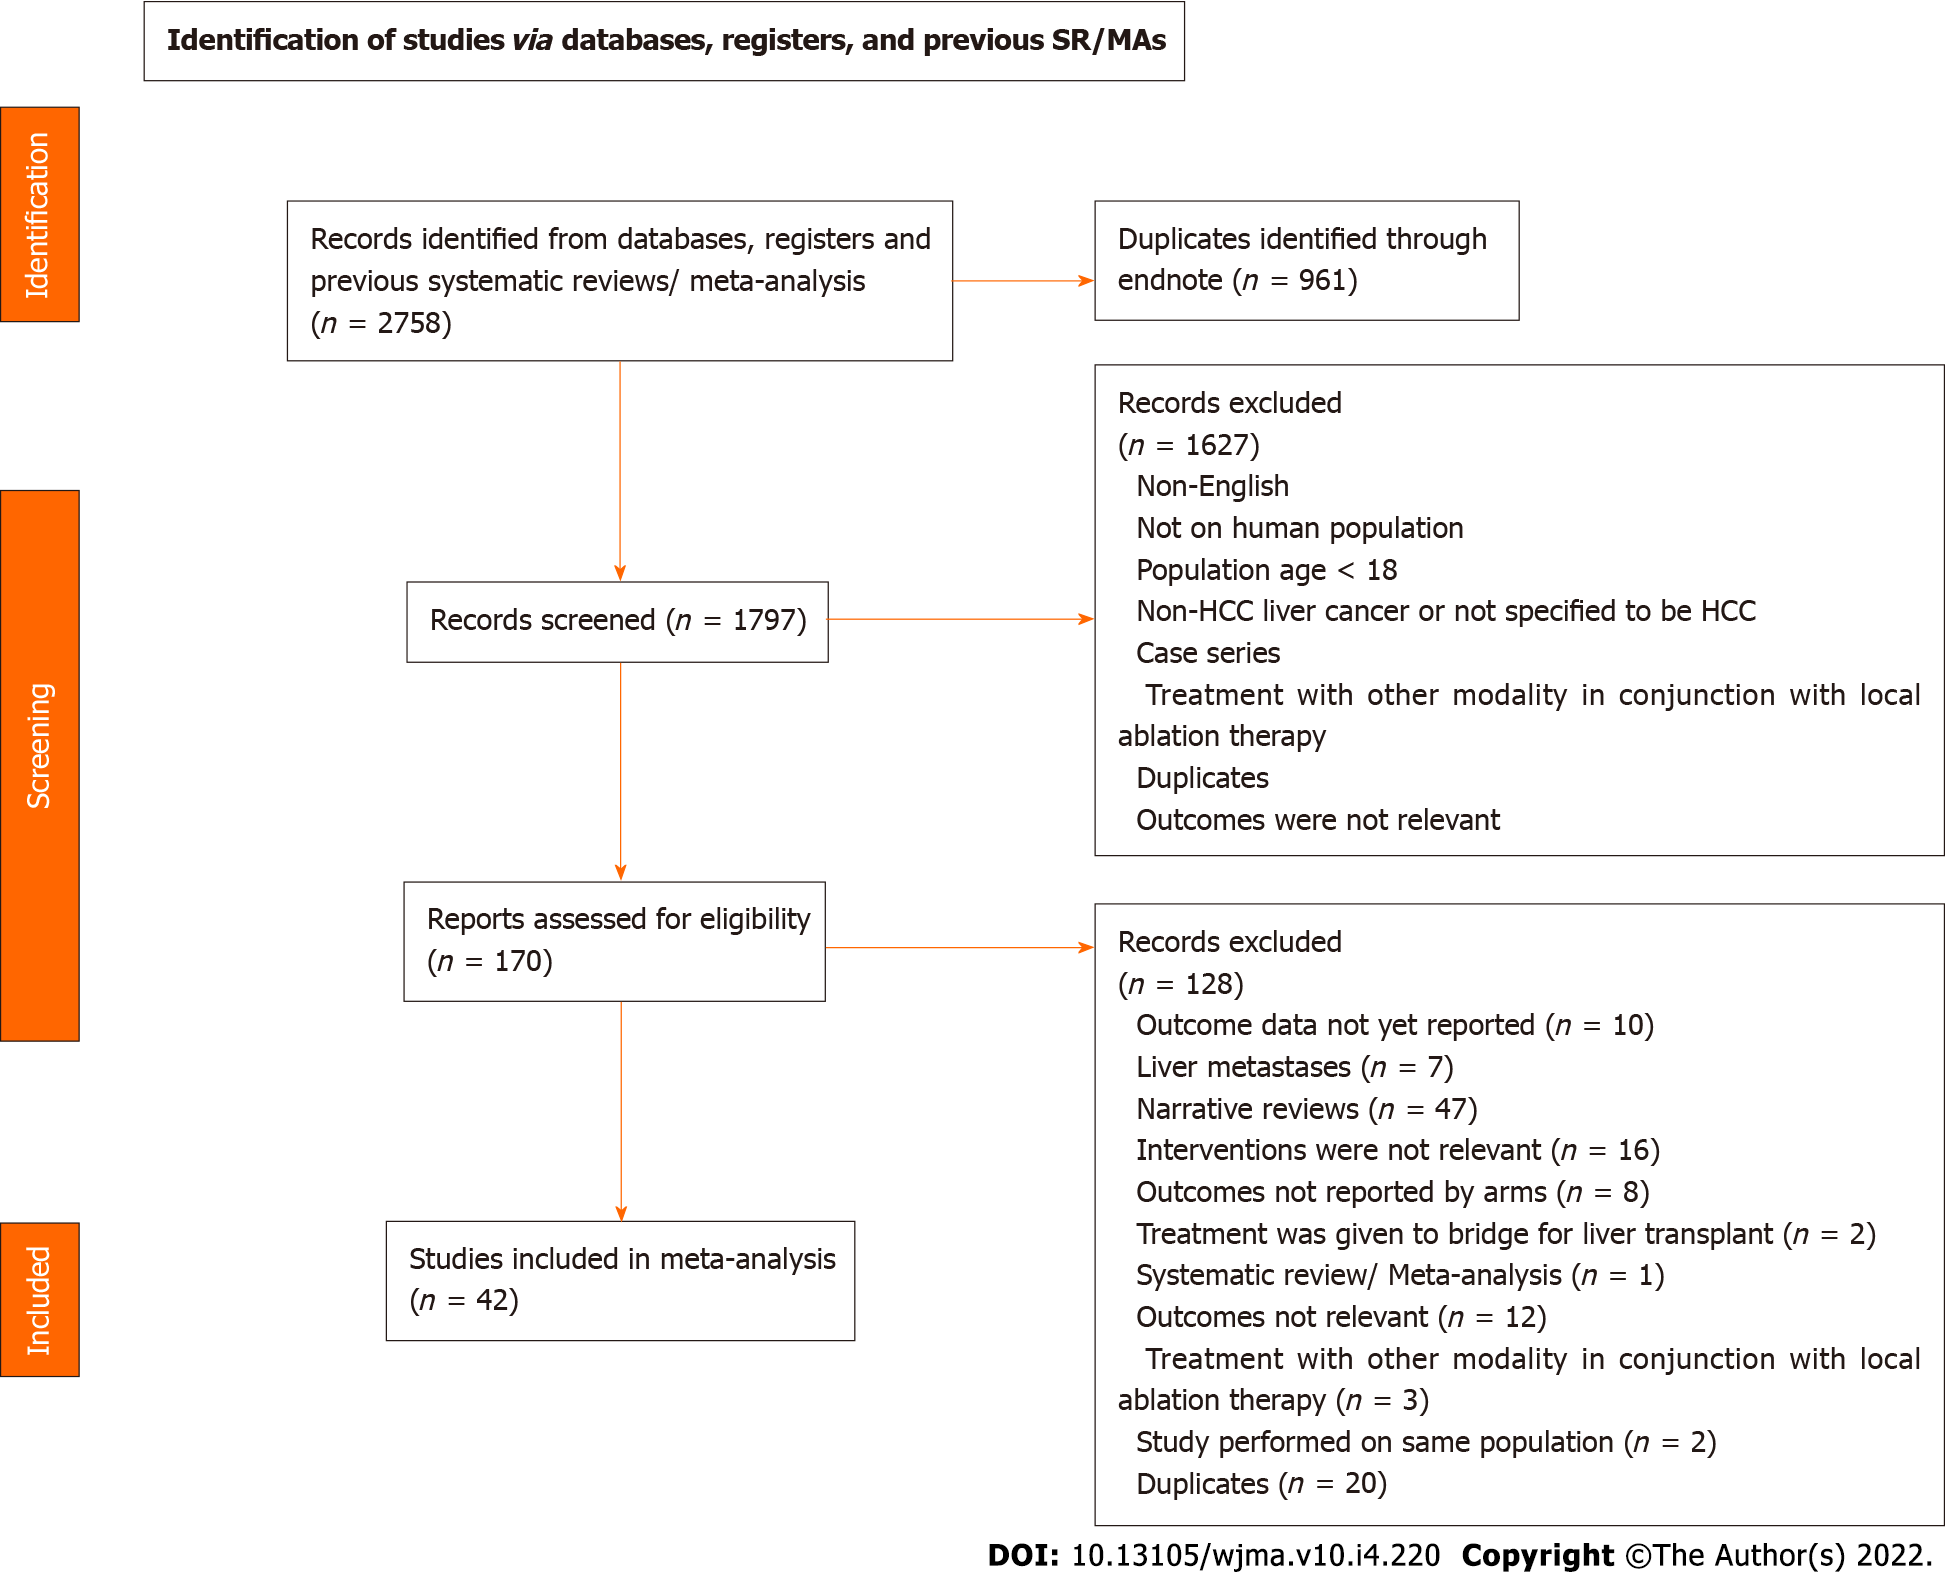
Figure 1
Flowchart of search strategy and article screening process.
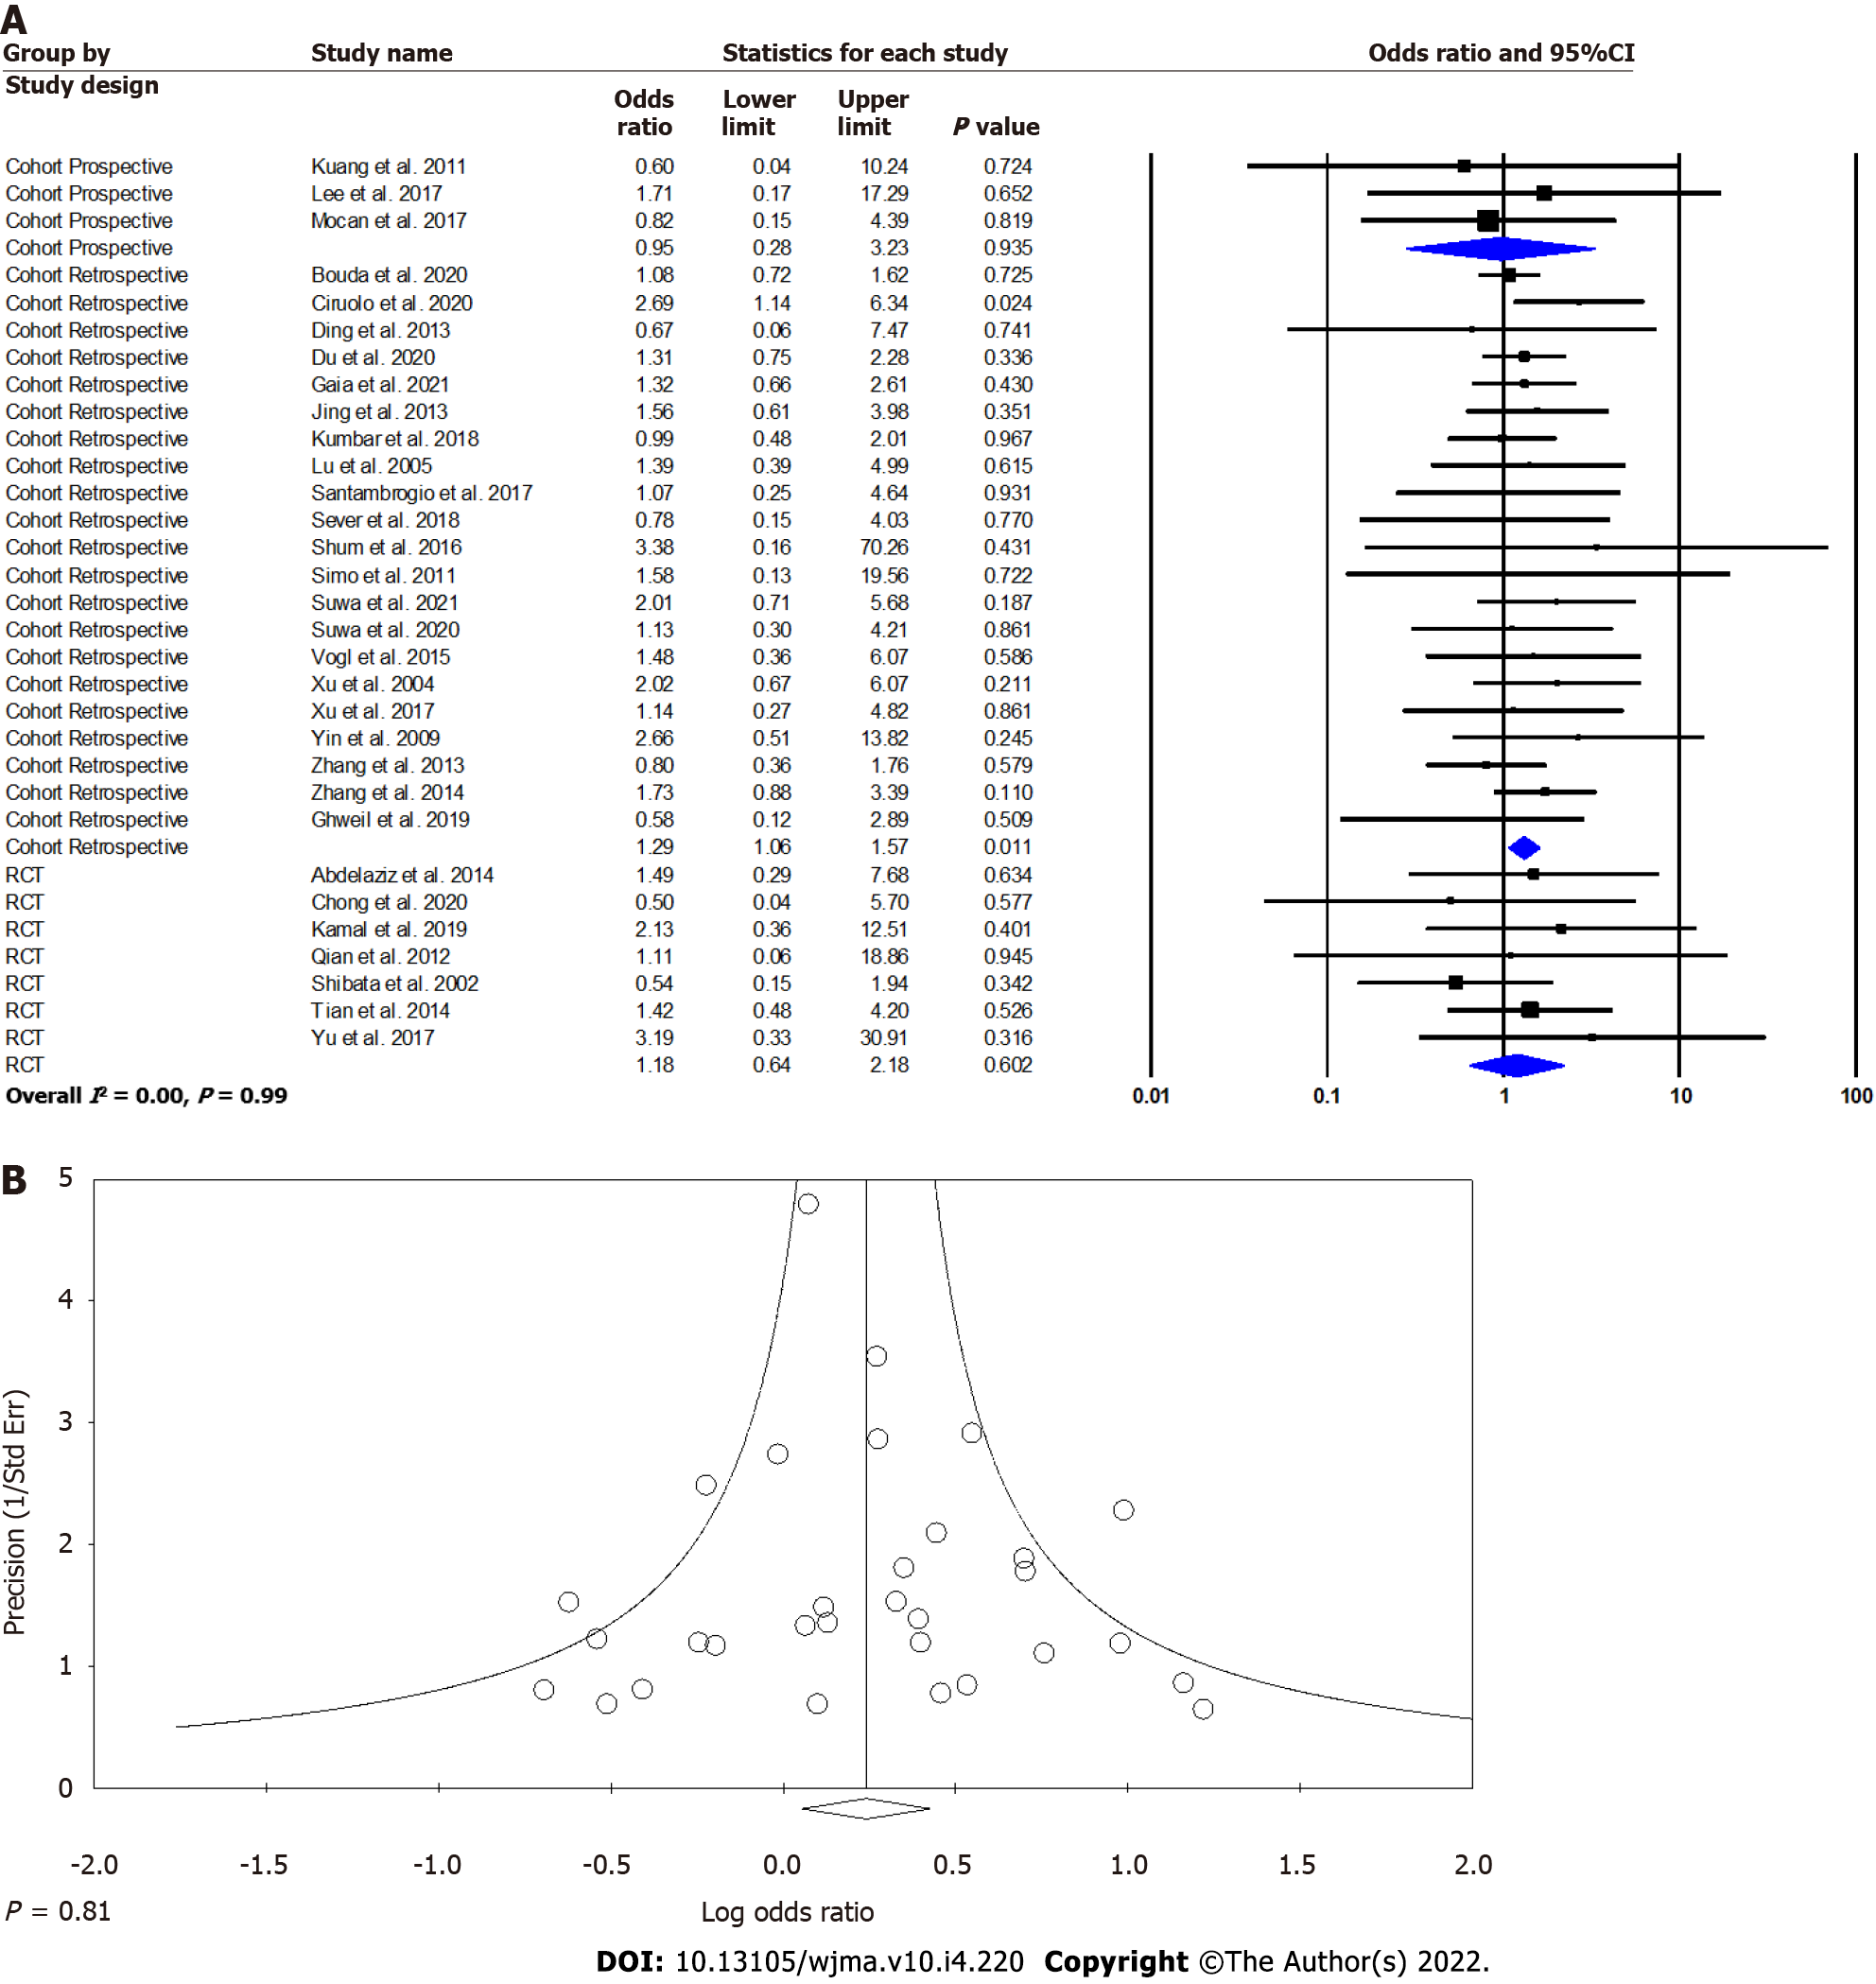
Figure 2 Forest plot and funnel plot.
A: Microwave ablation versus radiofrequency ablation for intrahepatic hepatocellular carcinoma lesions. Forest plot for complete ablation; B: Microwave ablation versus radiofrequency ablation for intrahepatic hepatocellular carcinoma lesions: Funnel plot for publication bias.
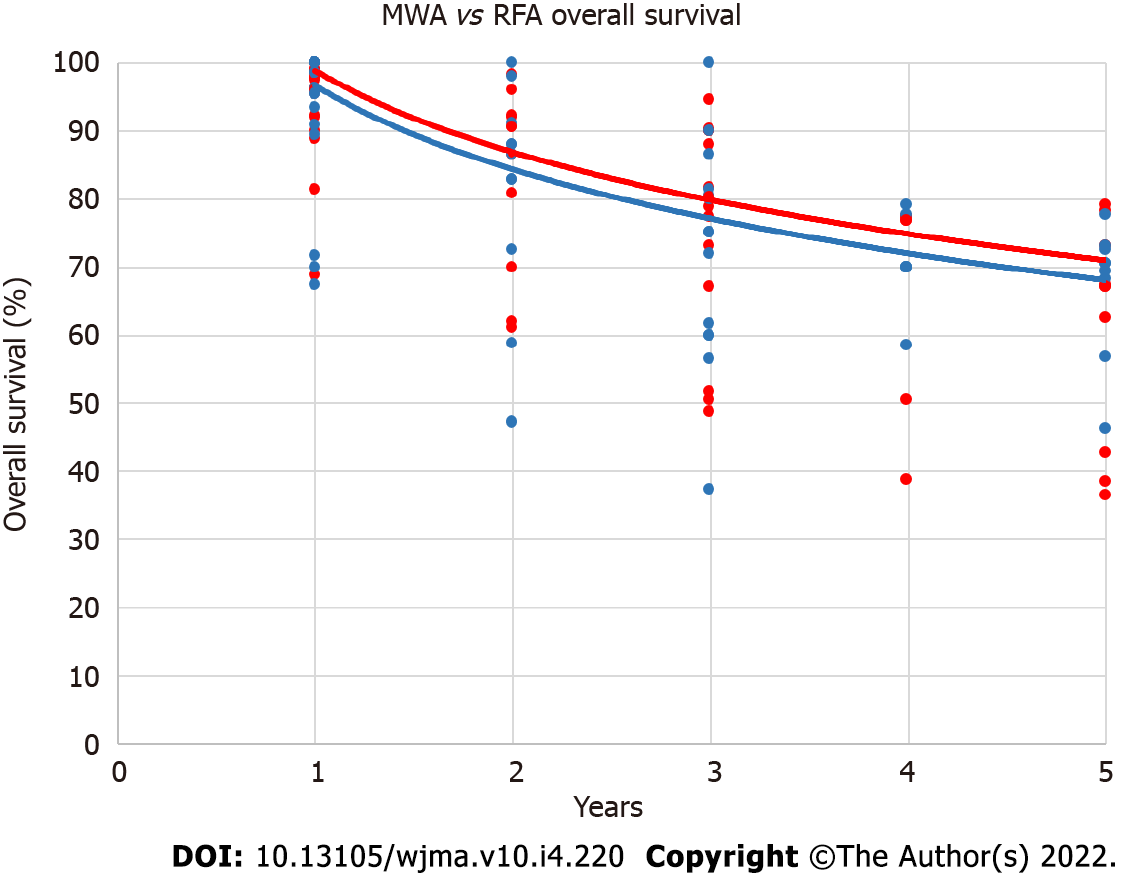
Figure 3 Dot plot of microwave ablation versus radiofrequency ablation overall survival rates over time.
Trendlines are based on median survival. Microwave ablation is represented by red dots and red trendline while radiofrequency ablation is represented by blue dots and blue trendline. MWA: Microwave ablation; RFA: Radiofrequency ablation.
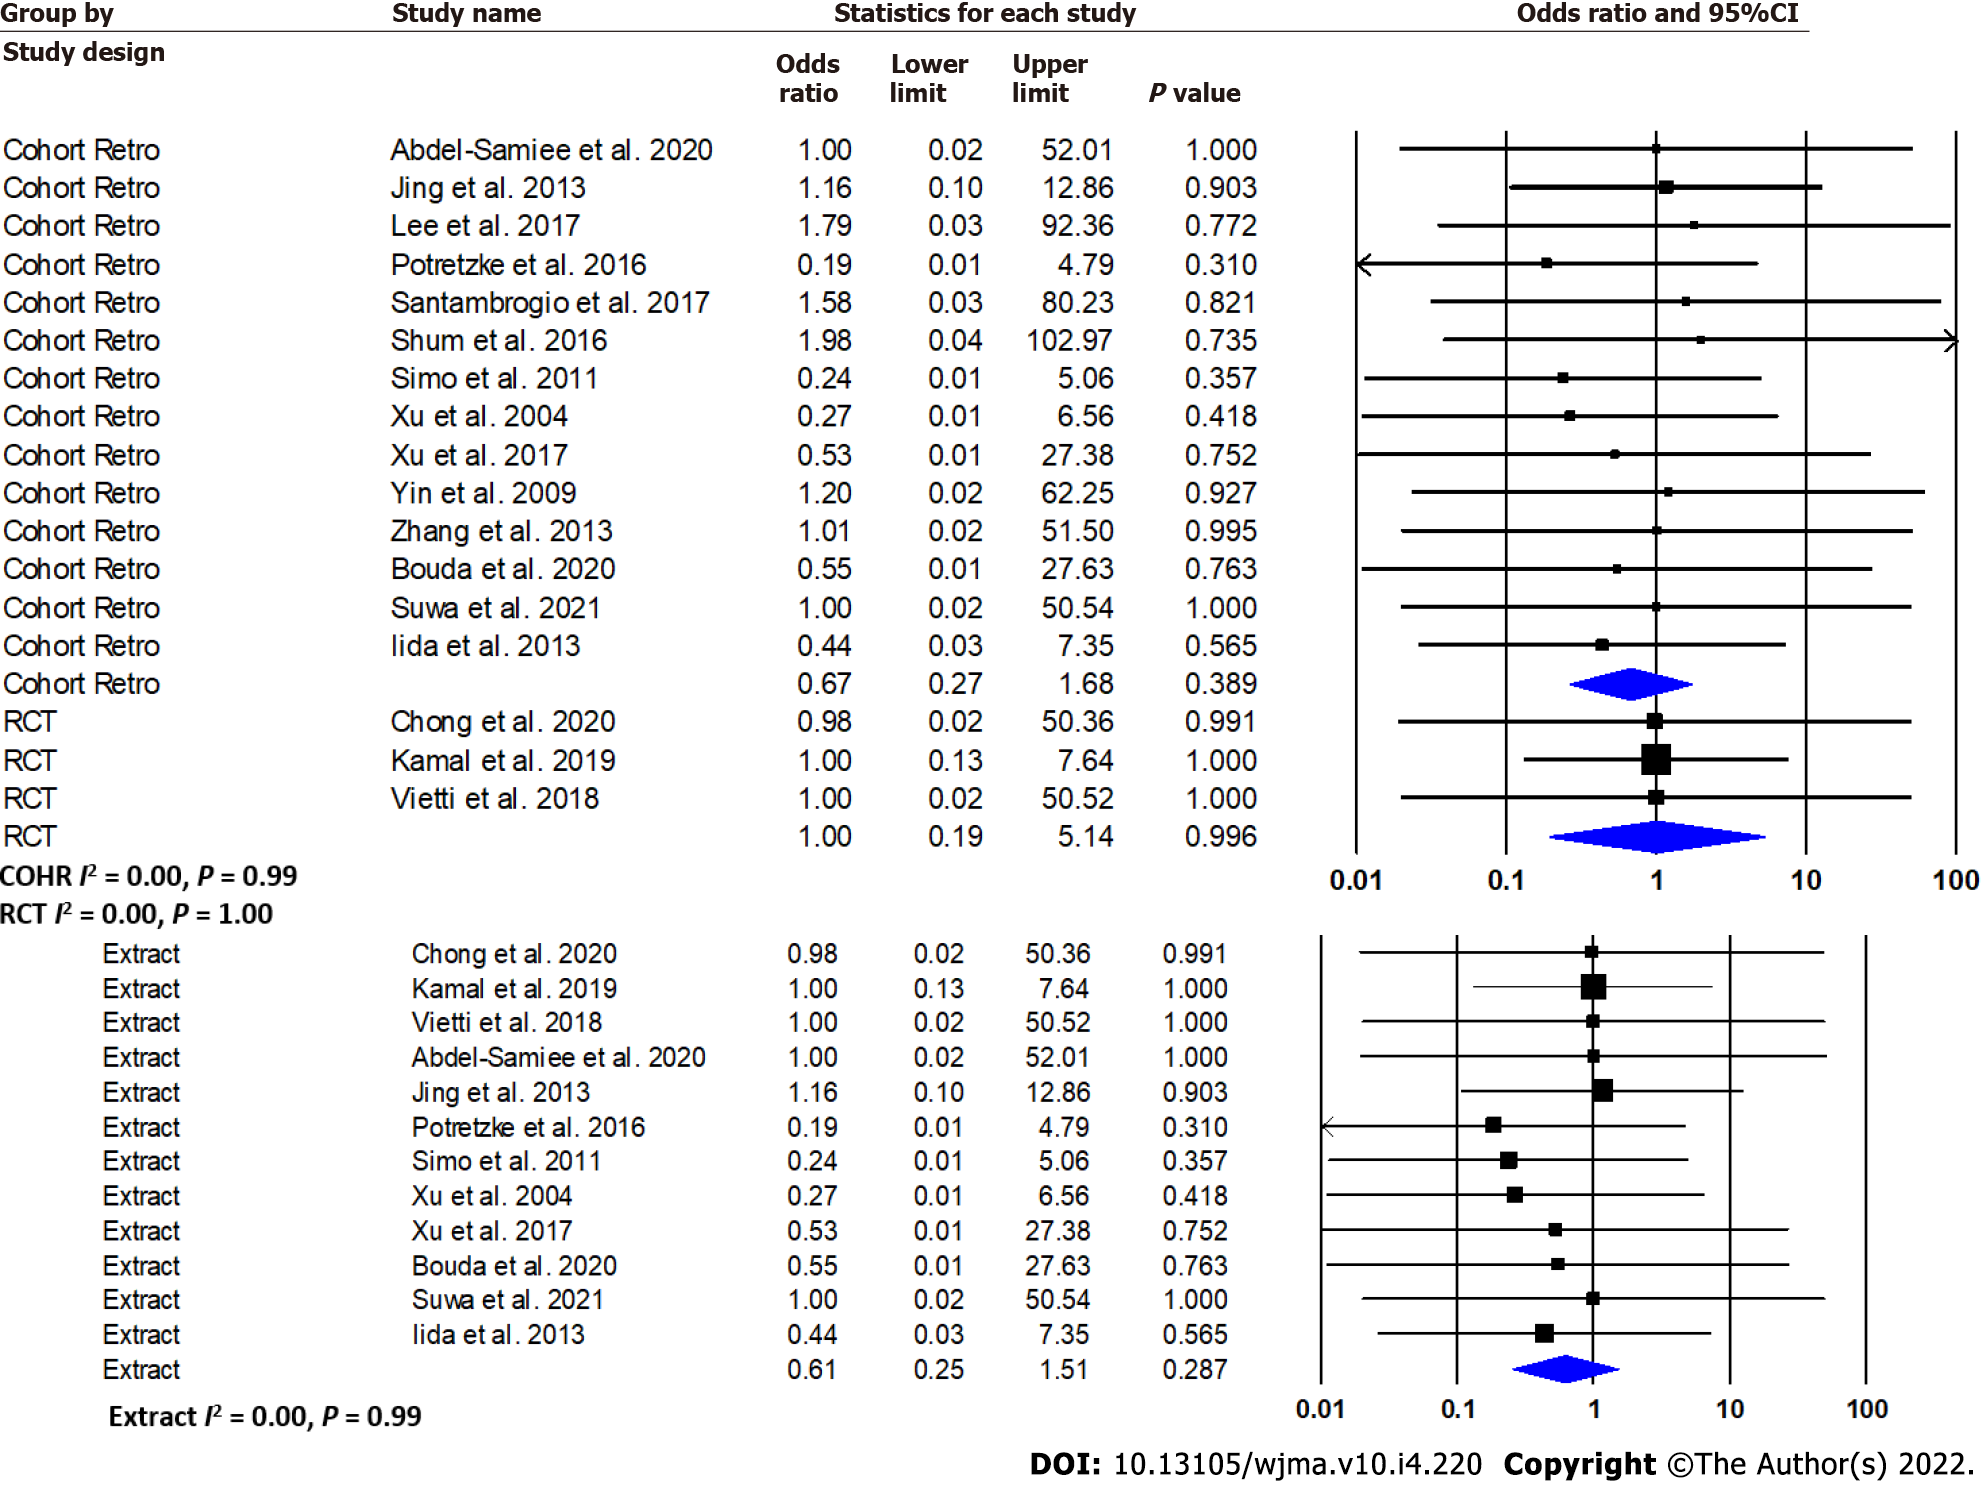
Figure 4
Microwave ablation versus radiofrequency ablation for intrahepatic hepatocellular carcinoma lesions: Forest plot for 30-d mortality.
- Citation: Tang MJ, Eslick GD, Lubel JS, Majeed A, Majumdar A, Kemp W, Roberts SK. Outcomes of microwave versus radiofrequency ablation for hepatocellular carcinoma: A systematic review and meta-analysis. World J Meta-Anal 2022; 10(4): 220-237
- URL: https://www.wjgnet.com/2308-3840/full/v10/i4/220.htm
- DOI: https://dx.doi.org/10.13105/wjma.v10.i4.220


