Copyright
©The Author(s) 2022.
World J Meta-Anal. Apr 28, 2022; 10(2): 52-62
Published online Apr 28, 2022. doi: 10.13105/wjma.v10.i2.52
Published online Apr 28, 2022. doi: 10.13105/wjma.v10.i2.52
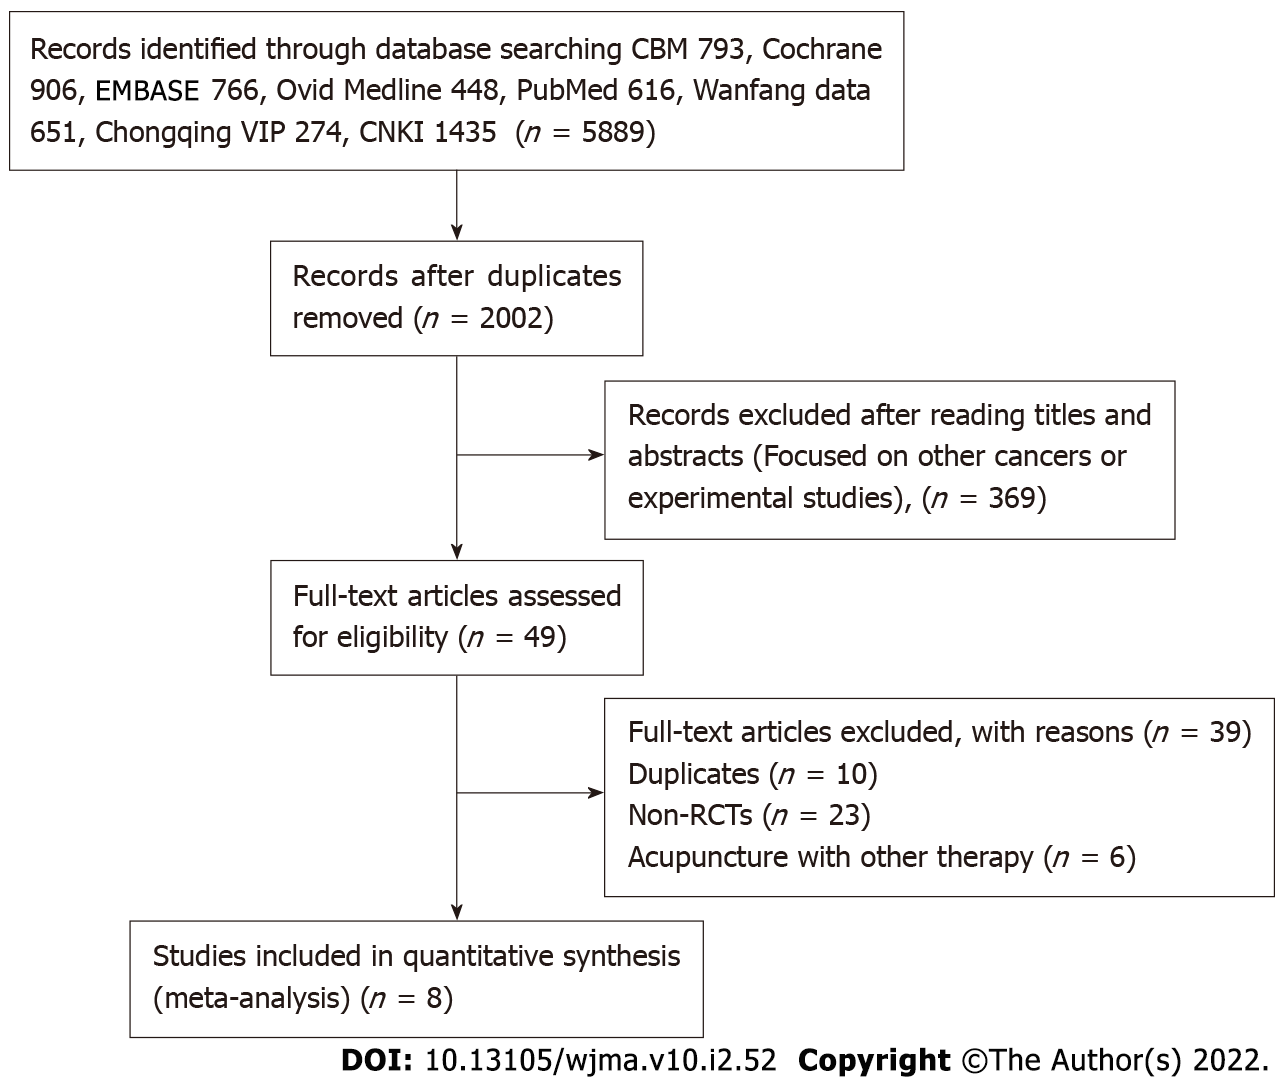
Figure 1 Flow chart of study inclusion.
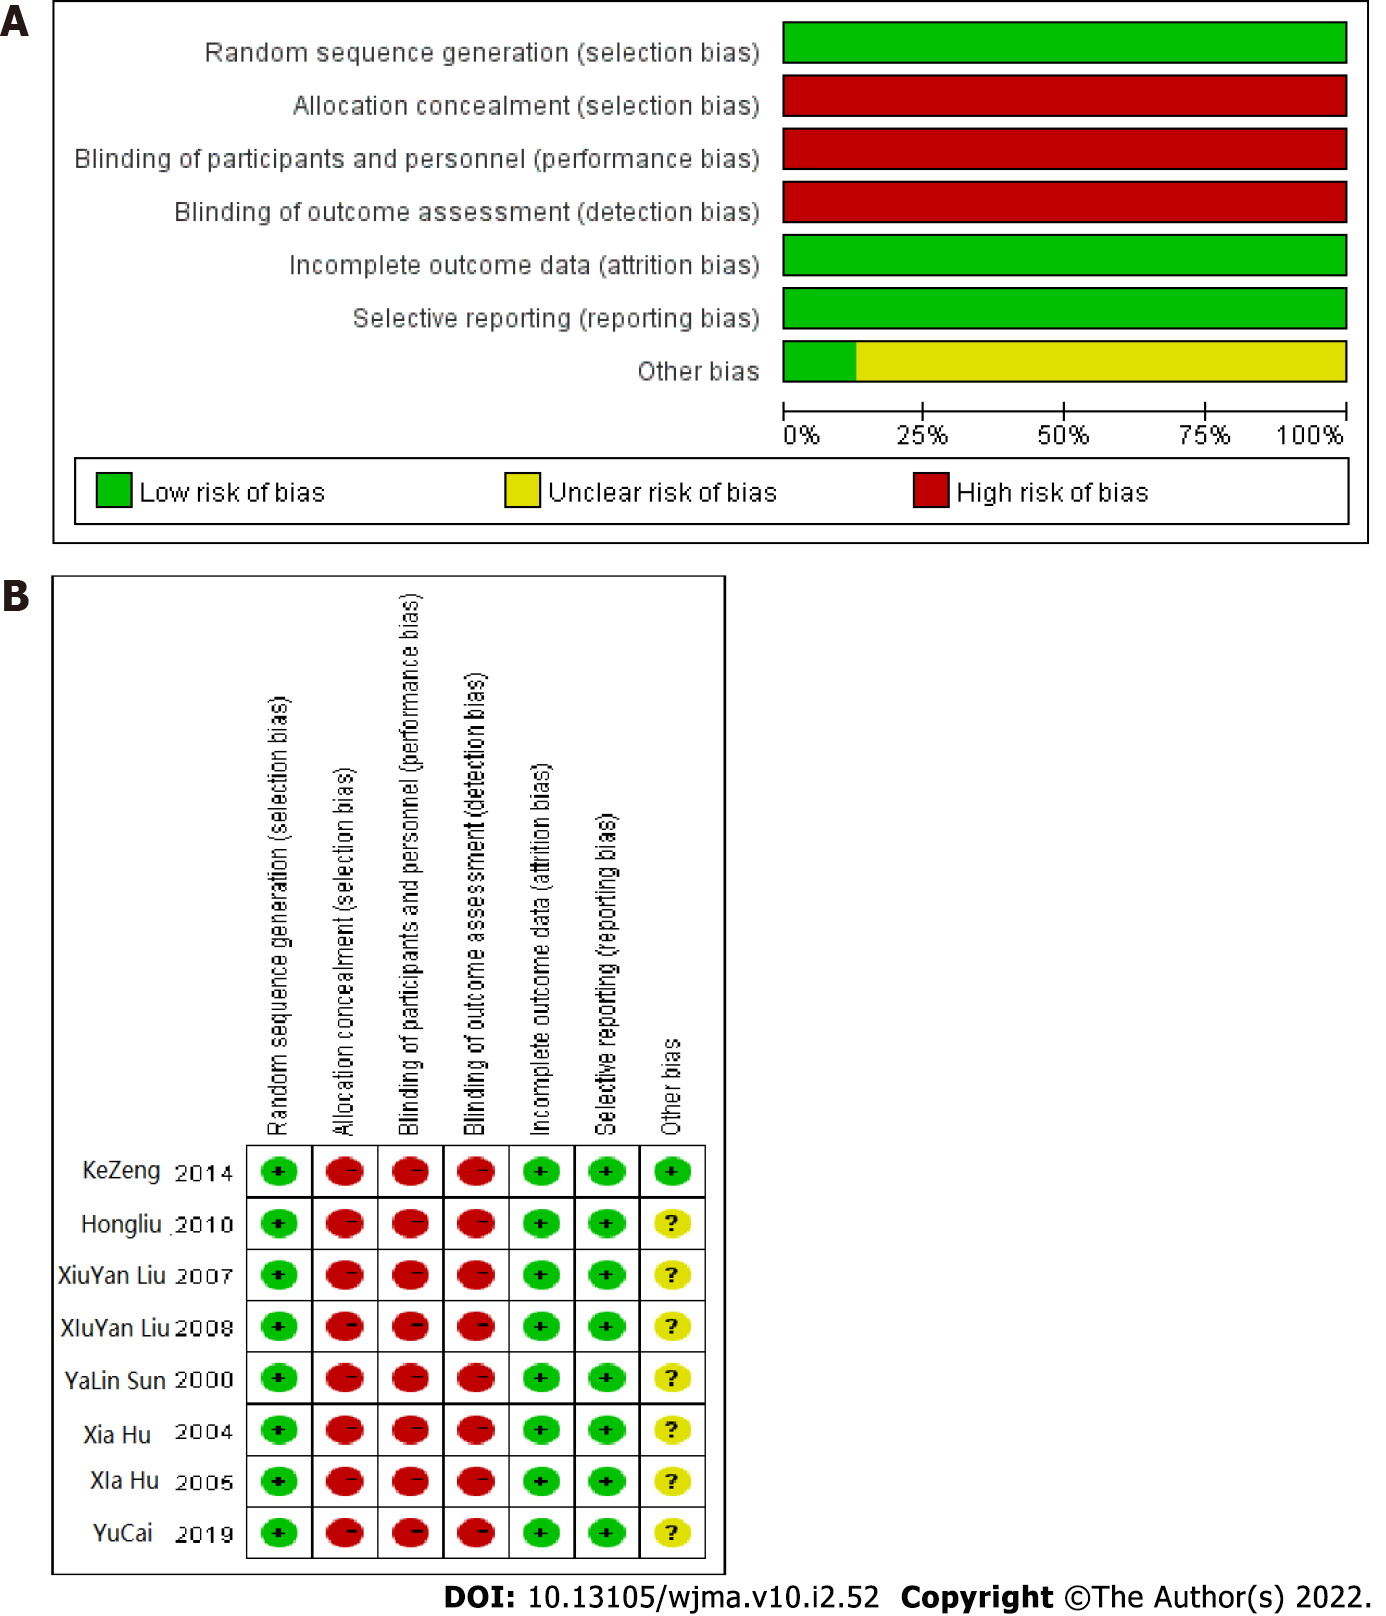
Figure 2 Assessment of quality of the literature.
A: Percentile chart of literature risk bias; B: Risk of bias assessment.
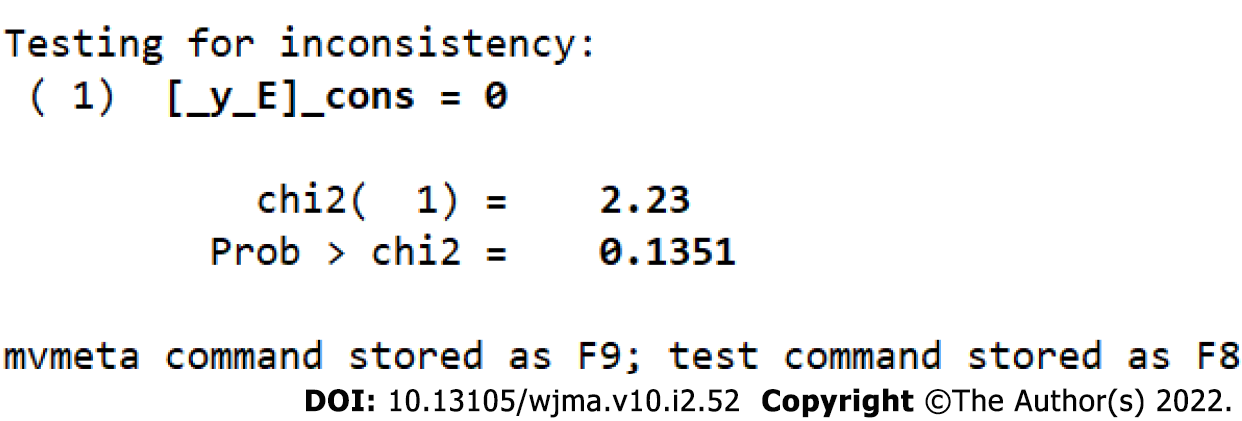
Figure 3 Test for inconsistency.
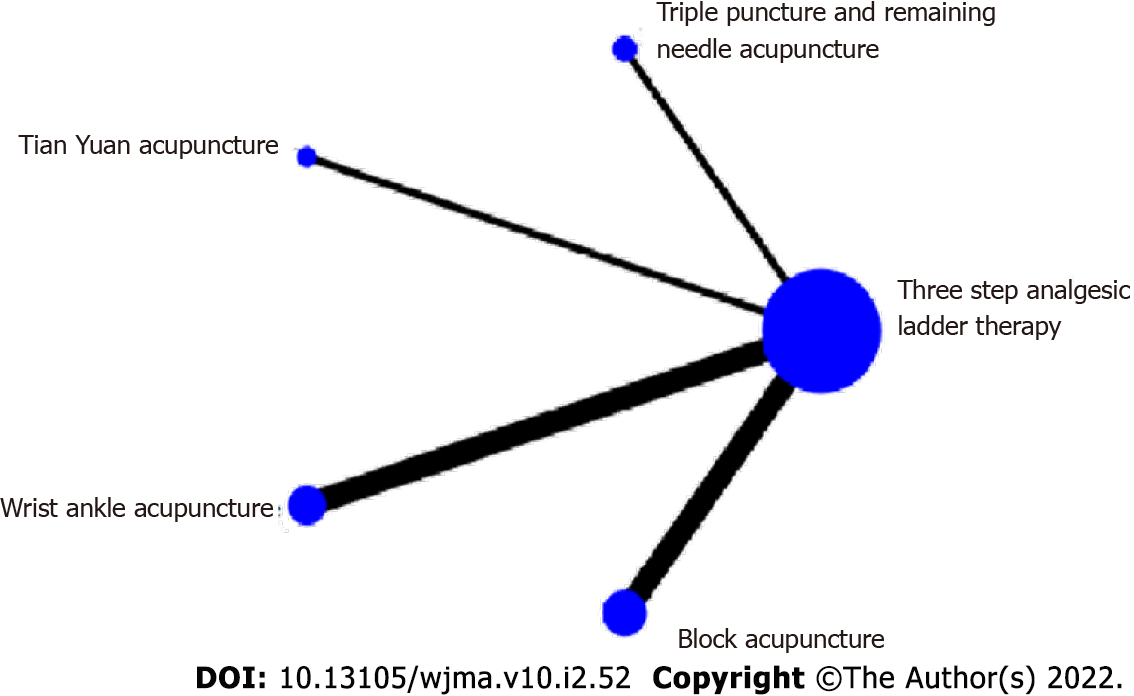
Figure 4 Network comparing the analgesic effect of different acupuncture methods.
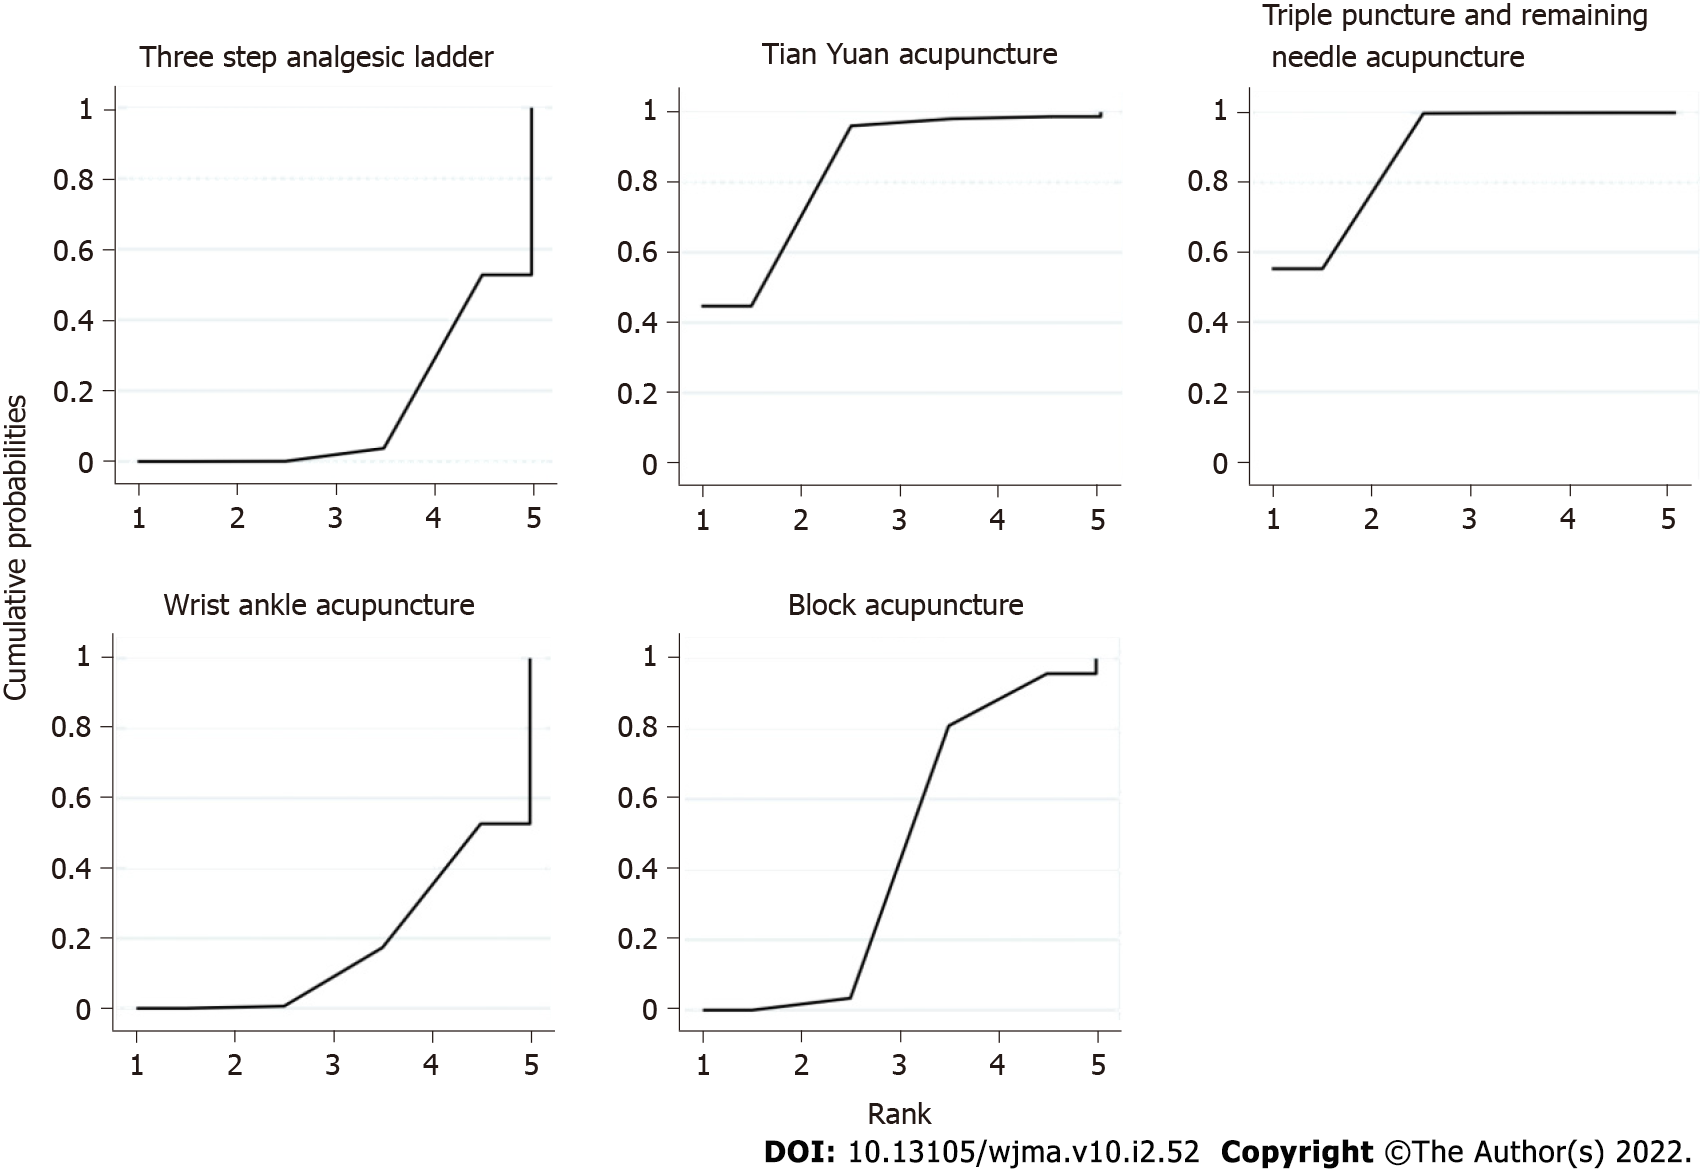
Figure 5 Probability ranking chart of treatment efficiency.
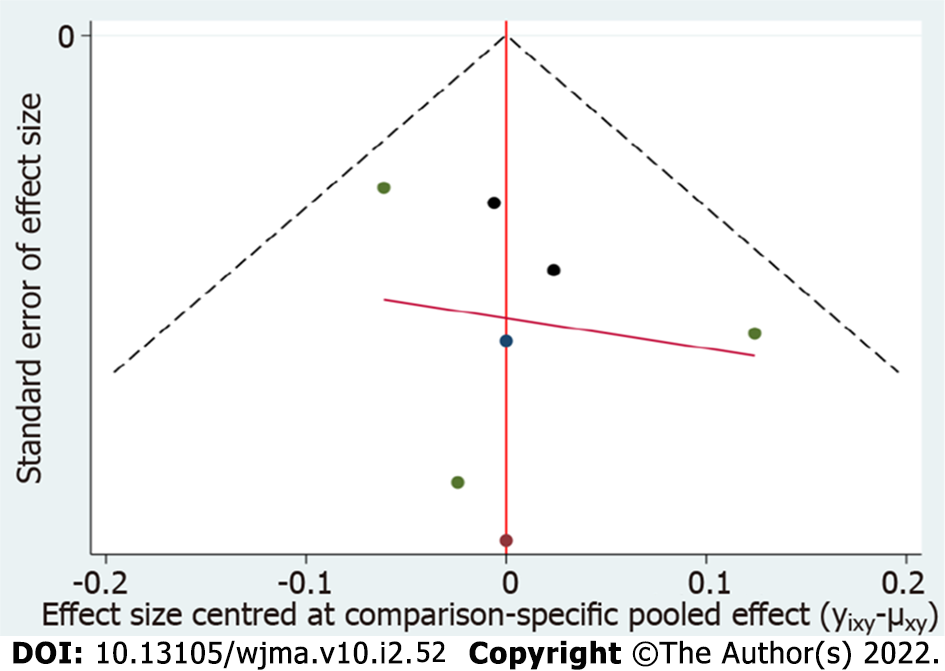
Figure 6 Efficient funnel chart.
- Citation: Mou HY, Chen J, Chen ZY, Du H. Different methods of acupuncture for relief of pain due to liver cancer: A network meta-analysis. World J Meta-Anal 2022; 10(2): 52-62
- URL: https://www.wjgnet.com/2308-3840/full/v10/i2/52.htm
- DOI: https://dx.doi.org/10.13105/wjma.v10.i2.52


