Copyright
©2013 Baishideng Publishing Group Co.
World J Meta-Anal. Nov 26, 2013; 1(3): 138-146
Published online Nov 26, 2013. doi: 10.13105/wjma.v1.i3.138
Published online Nov 26, 2013. doi: 10.13105/wjma.v1.i3.138
Figure 1 Flow diagram for this meta-analysis.
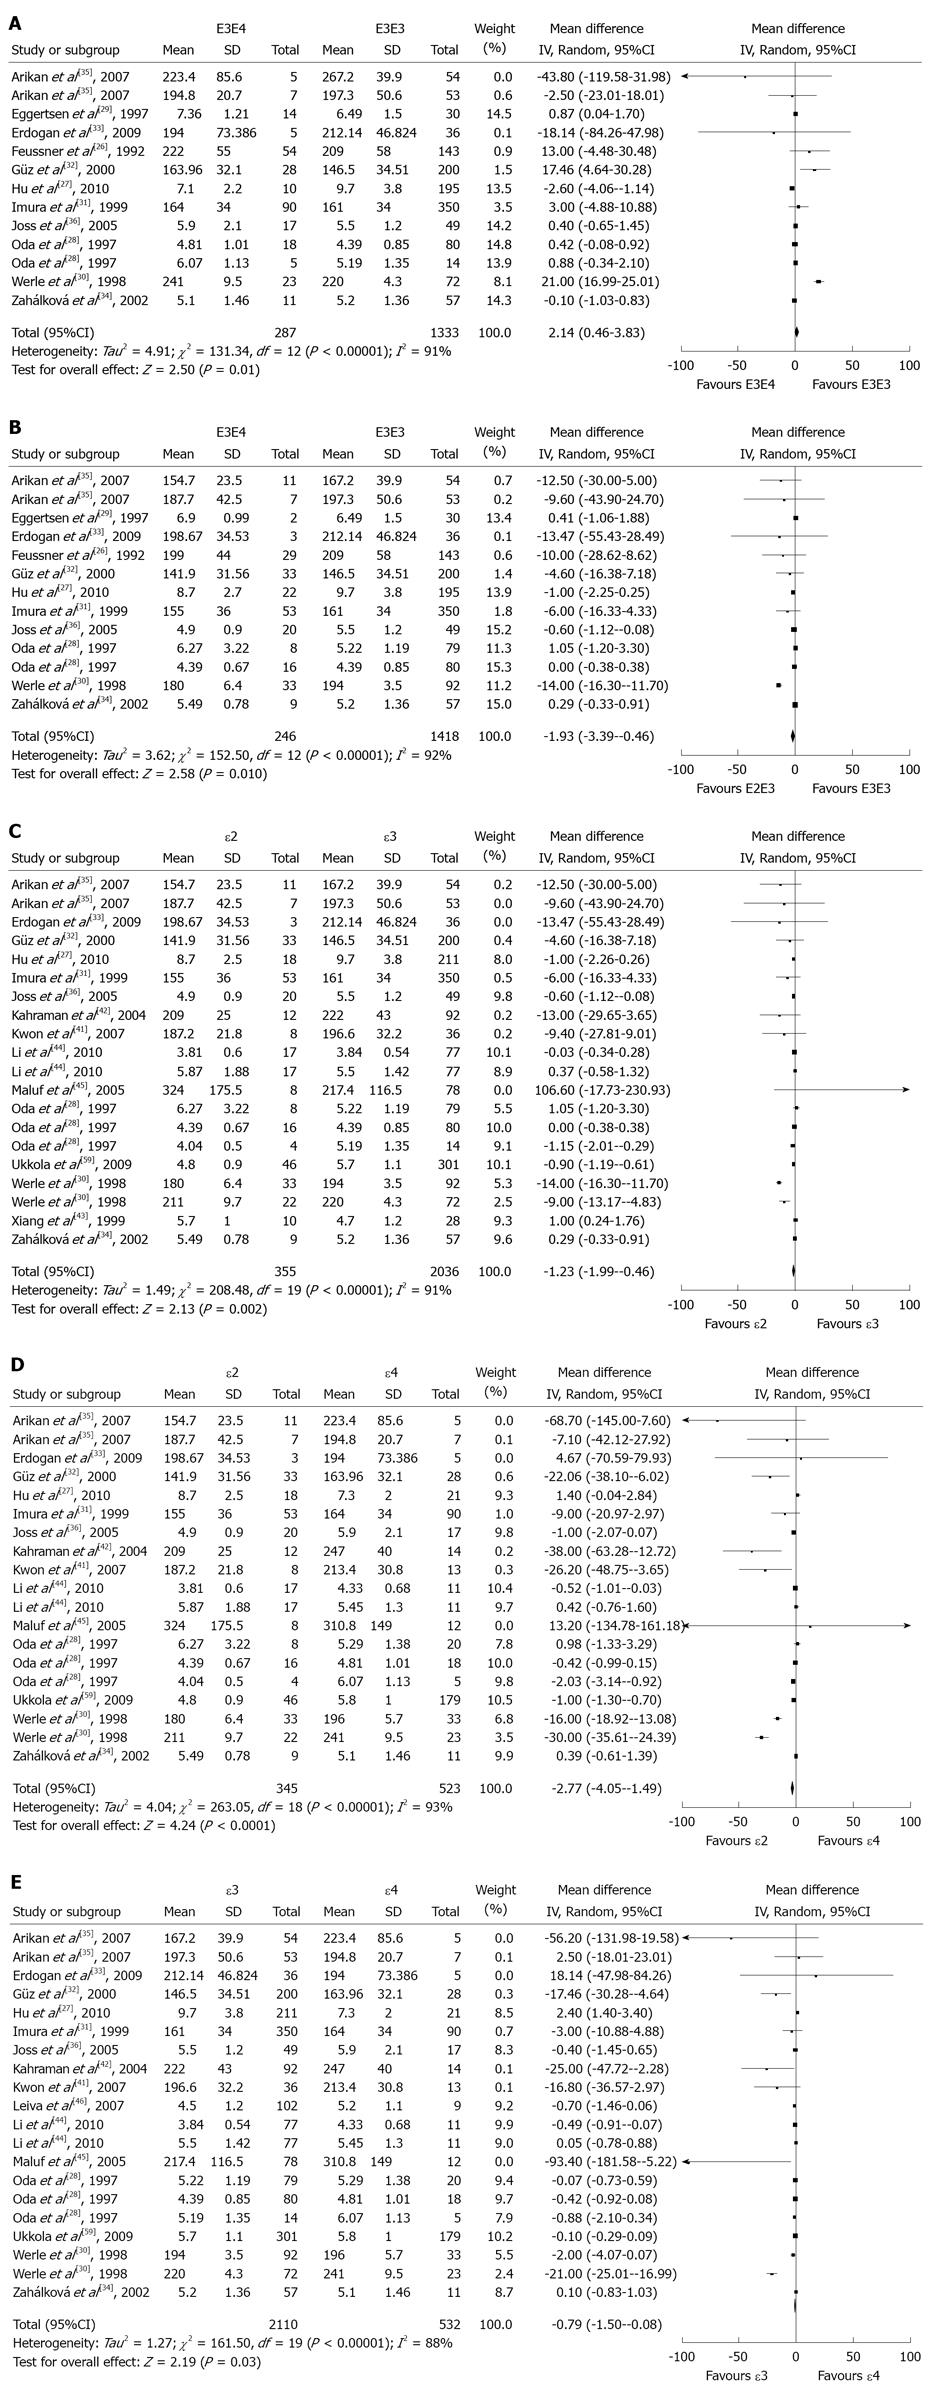
Figure 2 Association of apoE gene polymorphism with total cholesterol level.
A: Using the comparison of E3E4 vs E3E3; B Using the comparison of E2E3 vs E3E3; C: Using the comparison of ε2 vs ε3; D: Using the comparison of ε2 vs ε4; E: Using the comparison of ε3 vs ε4.
- Citation: Zhou TB, Jiang ZP, Yin SS, Qin YH. Relationship between apolipoprotein E gene polymorphism and total cholesterol level in patients with kidney diseases. World J Meta-Anal 2013; 1(3): 138-146
- URL: https://www.wjgnet.com/2308-3840/full/v1/i3/138.htm
- DOI: https://dx.doi.org/10.13105/wjma.v1.i3.138


